Introduction to Optionomics
Options intelligence for serious traders
Welcome to Optionomics
Optionomics helps you understand what’s happening in the options market. We track every options trade, analyze positioning data, and use AI to surface what matters—so you can focus on making informed decisions.
Before You Start
Optionomics provides data and analysis, not trading advice. We show you what’s happening in the market. What you do with that information is up to you.
If you’re new to options, take time to learn the fundamentals first. There’s no rush—contact us for a refund if you need more time. We’ll be here when you’re ready.
The Platform at a Glance
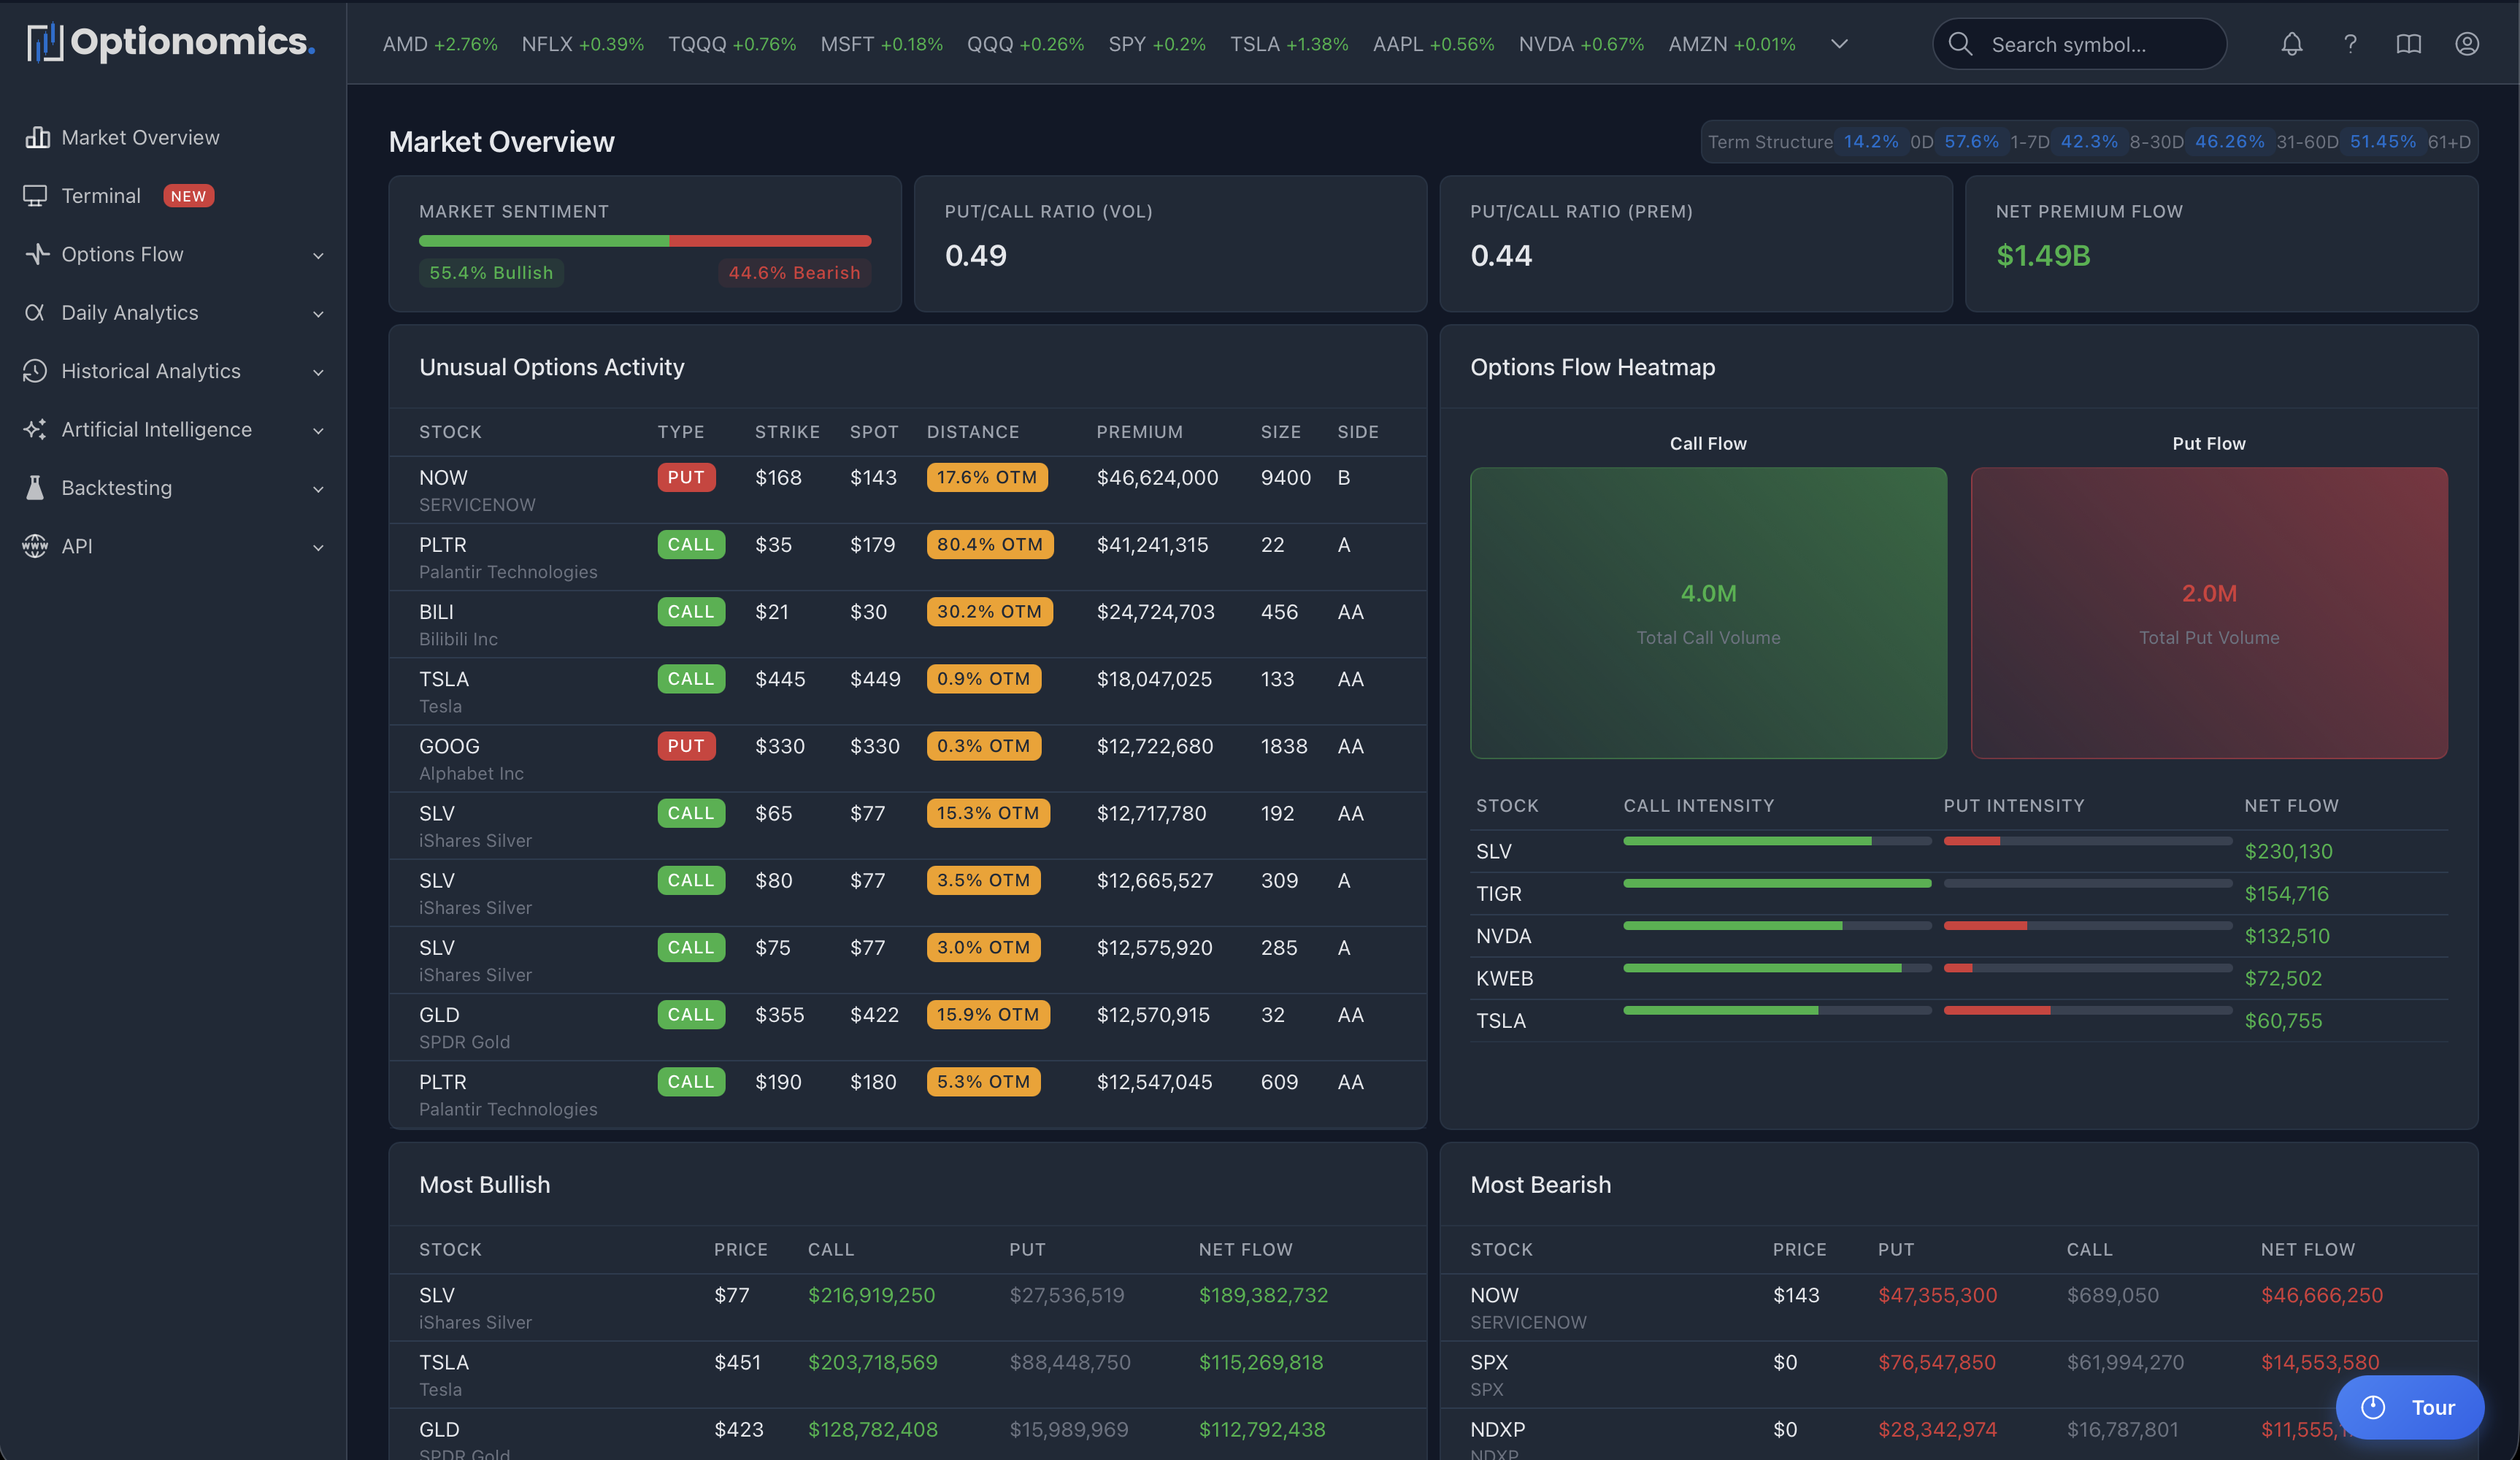
Navigation Essentials
| Element | Purpose |
|---|---|
| Watchlist | Your favorite stocks, always visible at the top |
| Search | Find any stock instantly |
| Notifications | Bell icon - real-time alerts and updates |
| Sidebar | All features organized by category |
Three Ways to Analyze
1. Options Flow — What’s Trading Now
Watch trades as they happen. See where the money is moving.
- Live Options Flow: Every trade, real-time
- Unusual Activity: AI-flagged trades that stand out
- Dark Pool Trades: Institutional block trades and off-exchange activity
- Flow Chart: Price + options flow visualization
- Terminal: All-in-one interface for day traders
→ Learn more about Options Flow
2. Daily Analytics — Today’s Positioning
Understand where all the money is positioned right now.
- Option Walls: Support/resistance from options
- Gamma Exposure: Market maker hedging pressure
- Delta Exposure: Aggregate directional positioning
- Volatility Skew: IV across strikes
- Term Structure: IV across expirations
→ Learn more about Daily Analytics
3. Historical Analytics — Patterns Over Time
15+ years of data to study how metrics evolved.
- Volatility Metrics: IV Rank, IV Percentile, RV, IV-RV spread
- Greeks History: GEX, DDE, Net Greeks over time
- Sentiment: Put/call ratios, market mood, sentiment analysis
- VIX-Style Metrics: Stock-specific volatility indices
- Trading Patterns: Expected move, momentum indicators
→ Learn more about Historical Analytics
AI Features
Click the sparkle icon (✨) on any chart for instant AI explanations. Available on Theta and Vega plans.
- AI Insights: Context-aware data and chart explanations
- AI Chatbot: Ask questions about markets, strategies, and concepts
- Volatility Forecasts: AI-powered IV predictions
- Anomaly Detection: AI-flagged unusual activity patterns
→ Learn more about AI Features
Who Uses Optionomics?
| You Are | You’ll Use |
|---|---|
| Day Trader | Live flow, unusual activity, Terminal, custom alerts |
| Swing Trader | Daily analytics, positioning changes, gamma trends |
| Options Seller | IV metrics, gamma exposure, option walls, volatility analysis |
| Researcher | Historical data, 15+ years of analytics |
| Algo Trader | REST API, backtesting engine (Vega plan) |
Getting Help
- Docs: You’re reading them
- In-App: Click (?) icons throughout the platform
- AI: Click ✨ on any chart (Theta/Vega)
- Email: [email protected]
Next Steps
Remember: We provide data and analysis tools—not trading advice. Options involve substantial risk. Do your own research.