Real-Time Options Flow
See every options trade as it happens
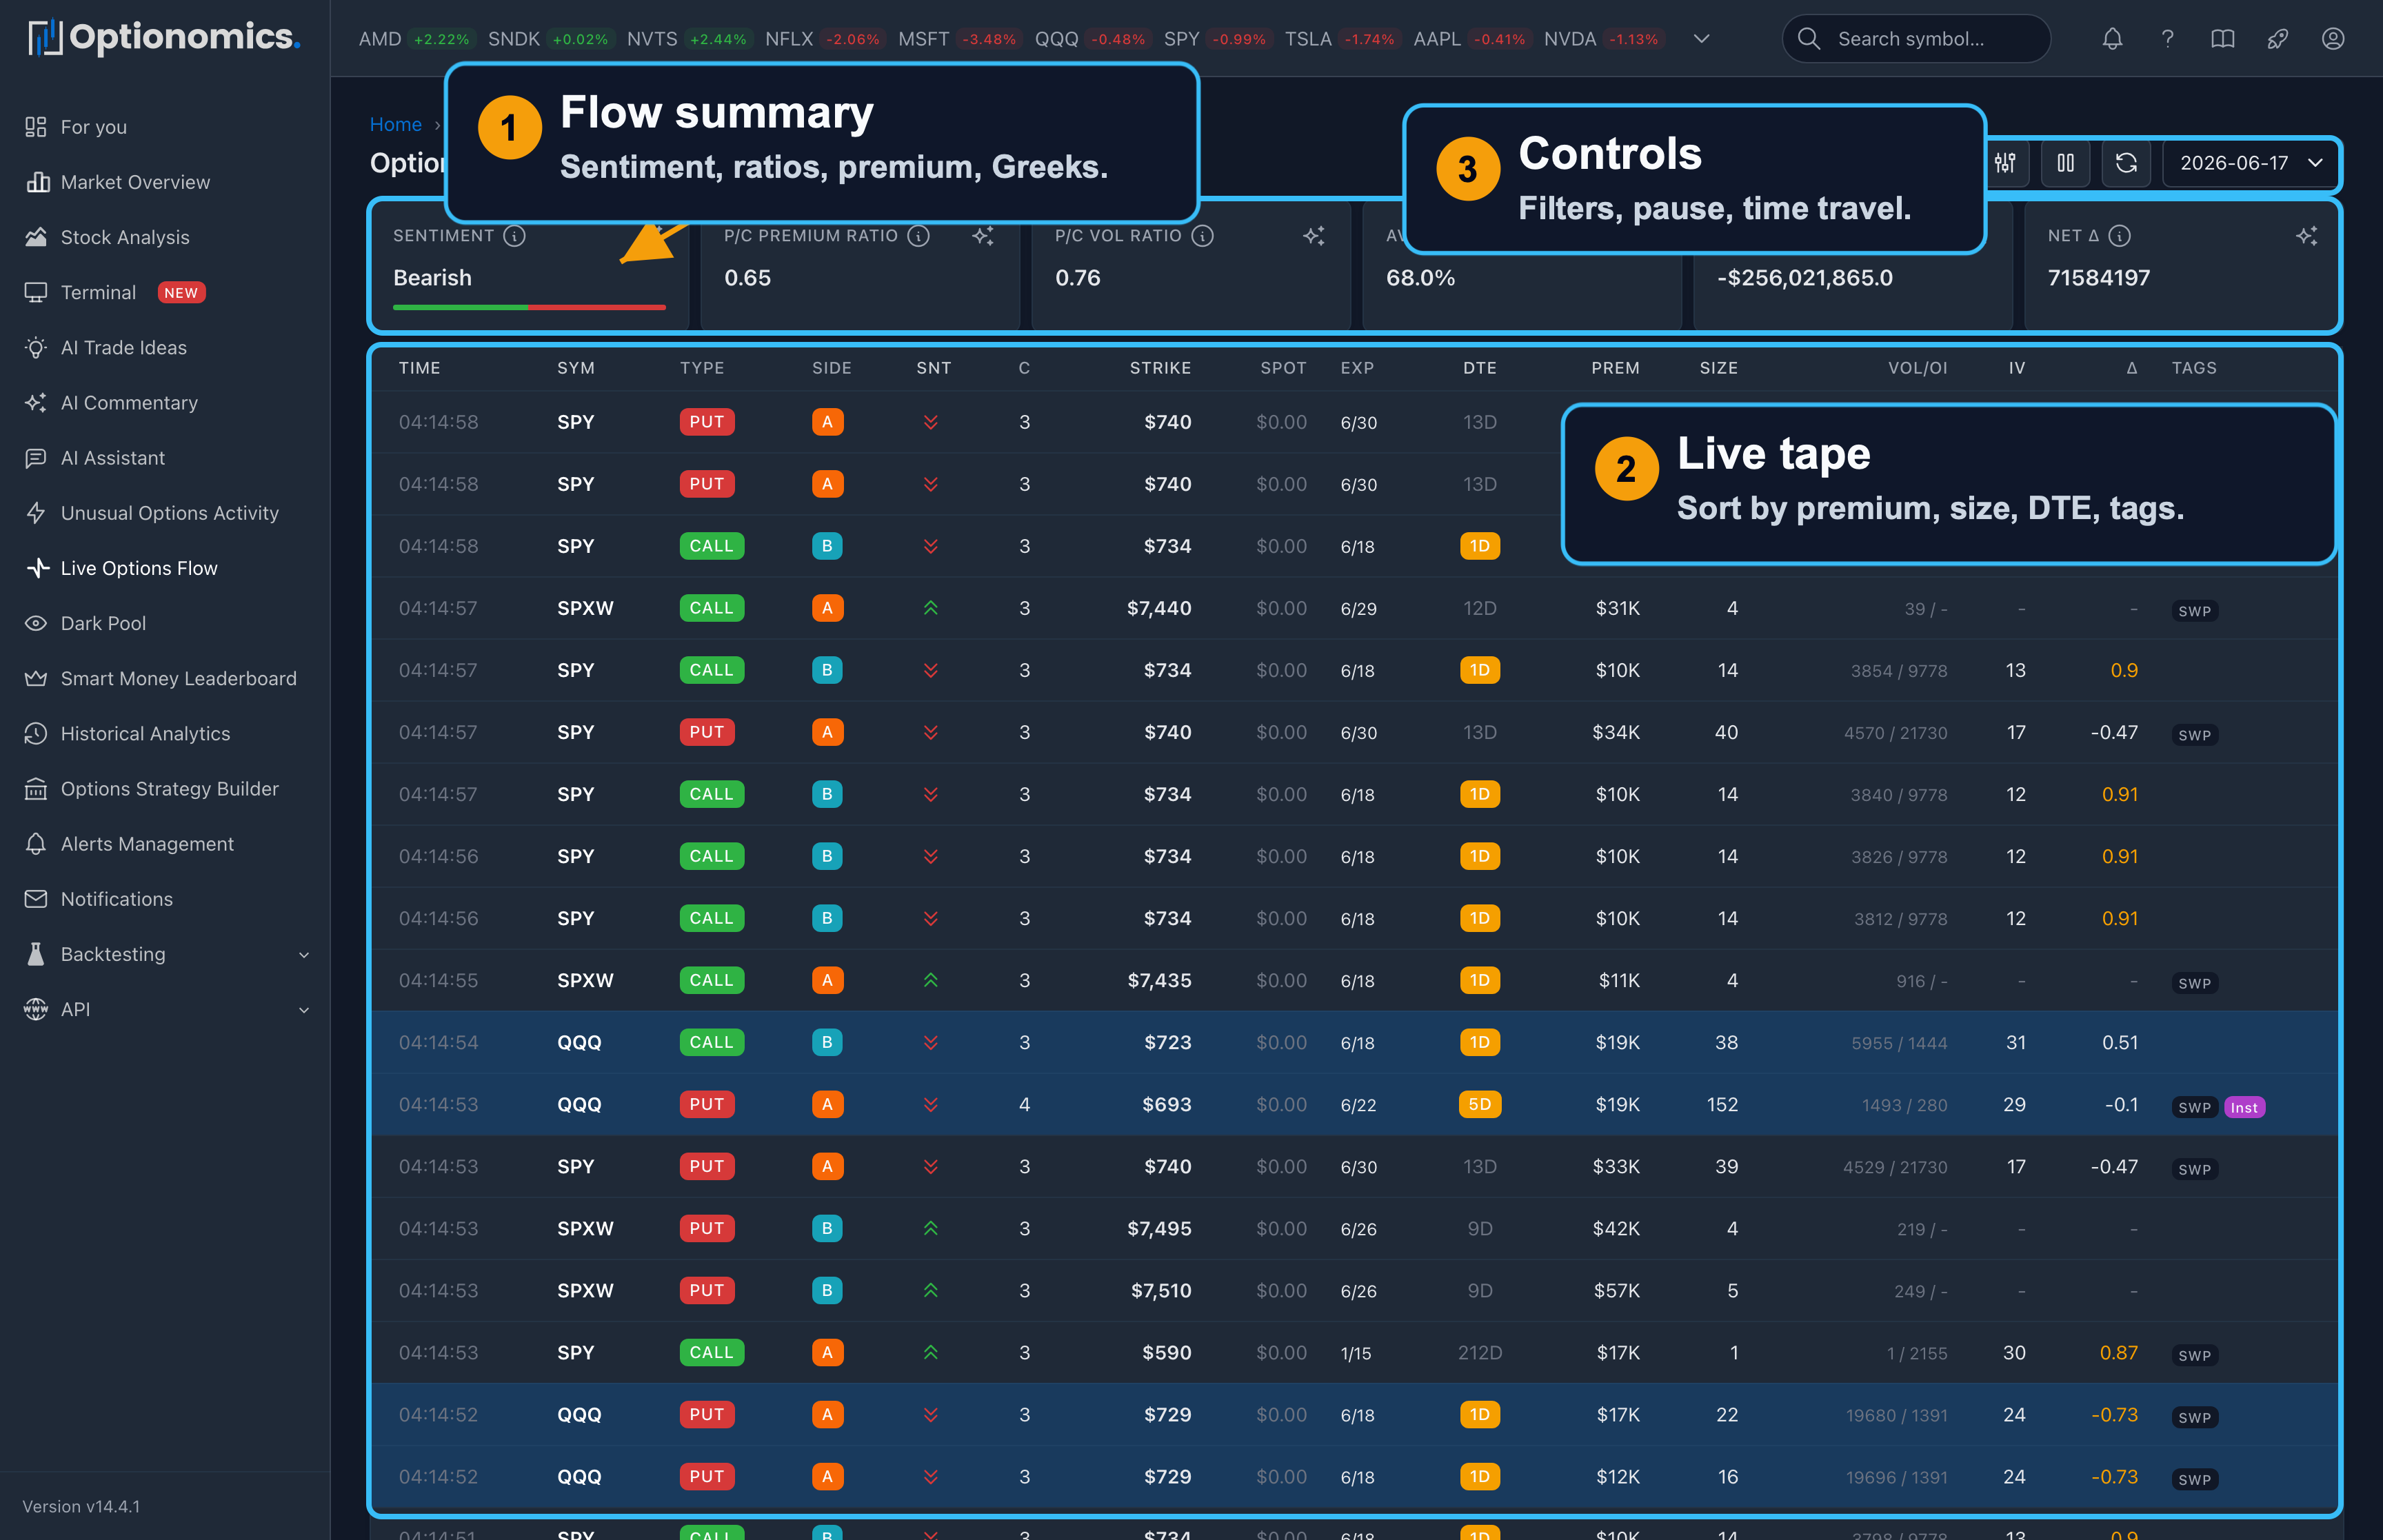
What live options flow is
Options flow is the live record of options prints: who is paying up for calls or puts, in what size, with what urgency, and at which strikes and expiries. Unlike equity tape alone, options flow encodes horizon (DTE), leverage, and often intent—though intent is inferred, never certain, from context such as volume versus open interest, execution side, and repetition.
Traders use flow to confirm or question a narrative: a chart breakout backed by aggressive call buying reads differently from one with only stock volume. Funds use it to monitor whether positioning agrees with their macro view on a name. Market makers and vol desks use it to sense near-term pin risk and skew pressure—even if you are not in those seats, you are looking at similar raw inputs.
Optionomics presents flow in sortable tables with tags (sweeps, blocks, ISO) and sentiment hints so you can move from “something traded” to “what traded and how it traded,” then branch to Unusual Activity, the chart inside the Terminal, or daily analytics for the next layer of structure.
Who it is best for: Active intraday and swing traders, catalyst-driven names, and anyone building alerts off live prints.
Availability: Gamma plan and higher ($59/month+)
The Flow Table
Each row is a single options trade with these columns:
| Column | What It Tells You |
|---|---|
| Time | When the trade executed |
| Sym | Stock ticker |
| Type | Call or Put |
| Side | Where it traded (AA/A/M/B/BB) |
| Snt | Sentiment (bullish/bearish/neutral) |
| C | Confidence score (1-5) |
| Strike | Option strike price |
| Spot | Current stock price |
| Exp | Expiration date |
| DTE | Days to expiration |
| Prem | Total premium ($) |
| Size | Number of contracts |
| Vol/OI | Volume vs Open Interest |
| IV | Implied volatility |
| Δ | Delta |
| Tags | Sweep, Block, ISO |
Execution Side
The side tells you how aggressively the trade was executed:
| Side | Meaning |
|---|---|
| AA | Above Ask—very aggressive buy |
| A | At Ask—aggressive buy |
| M | Mid-market—neutral |
| B | At Bid—aggressive sell |
| BB | Below Bid—very aggressive sell |
Key insight: Buying at ask (paying more) shows urgency. Selling at bid (accepting less) shows urgency to exit.
Trade Types
Sweeps
Orders that sweep across multiple exchanges to get filled immediately. High urgency, high conviction.
Blocks
Large negotiated trades executed as single transactions. Typically institutional.
ISO (Intermarket Sweep Orders)
Priority orders that cross multiple exchanges simultaneously. Time-sensitive execution.
Dashboard Metrics
At the top of the page, you’ll see aggregated flow data:
| Metric | Description | Interpretation |
|---|---|---|
| Sentiment | Bullish/Bearish/Neutral distribution | % of trades by direction |
| P/C Premium | Put/Call ratio by dollar spent | >1.0 = more $ in puts (bearish) |
| P/C Volume | Put/Call ratio by contracts | >1.0 = more put contracts (bearish) |
| Avg IV | Average implied volatility across trades | Higher = more expensive options |
| Net Premium | Calls minus puts ($ flow) | Positive = net call buying |
| Net Δ | Net delta exposure | Positive = bullish positioning |
| Total Premium | Total $ traded in options | Shows overall activity level |
| Trade Count | Number of trades displayed | Filtered trade count |
Quick Filters
Pre-configured filters for common use cases:
| Filter | Criteria | What It Shows |
|---|---|---|
| Smart Money | Sweeps + $100K+ premium | Urgent, large institutional trades |
| Whales | $500K+ premium | Massive trades from large players |
| 0DTE | Same-day expiration | High-risk, event-driven gamma plays |
| Institutional | Trades flagged as likely institutional | Size, structure, and execution consistent with institutional activity |
Custom Filters: Create your own filters by combining:
- Symbol, premium range, DTE range
- Trade types (sweep, block, ISO)
- Execution side (AA, A, M, B, BB)
- Volume/OI ratio, unusual score
Reading Flow: Quick Guide
| Signal | Interpretation | Action |
|---|---|---|
| Large premium + Sweep + At Ask | Strong directional conviction | Watch for price follow-through |
| Block trade + Far OTM | Institutional hedge or spec bet | Check for news/catalysts |
| High volume vs OI (>2.0) | New positions being built | Monitor for continued accumulation |
| 0DTE activity | Event-driven or gamma plays | Expect volatility, check calendar |
| Repeated trades same strike | Accumulation or distribution | Look for pattern continuation |
| Sweep + ISO + Above ask | Maximum urgency | Strongest conviction signal |
Premium Size Context
| Premium | Likely Source | Typical Strategy |
|---|---|---|
| >$1M | Hedge funds, institutions | Major positioning, hedging |
| $500K-$1M | Large traders, small funds | Significant directional bets |
| $100K-$500K | Serious retail, small institutions | Swing trades, spreads |
| $25K-$100K | Active retail traders | Day trades, weekly plays |
| <$25K | Retail traders | Speculative, small positions |
Important: Large trades can be:
- Opening new positions (bullish/bearish)
- Closing existing positions (profit-taking, loss-cutting)
- One leg of a spread (incomplete picture)
- Hedges for stock positions (opposite sentiment)
Always consider context: news, technicals, overall flow direction.
Live stream controls
Above the flow table you’ll find a Pause / Play control on the live stream. Pause when you want to read a row without it scrolling away; resume to keep reading the tape. Filters narrow the table by symbol, premium, DTE, side, trade type, and more, and chosen filters persist as you switch around. A date selector (Time Travel) lets you replay a prior session’s tape.
Saved Views: once you’ve dialed in a filter combination you like, save it as a named view and reapply it in one click on a later visit.
Terminal
For power users with focus on day trading, the Terminal provides:
- Three-column layout: chart in the center, AI tabs on the left, switchable live panel on the right (Unusual Activity, Options Flow, Key Levels, Market Scanner, Watchlist, Alerts)
- Advanced charting with overlays (S/R, dark pool, GEX, option chain walls, net flow), drawing tools, and indicators
- A preset-based Market Scanner (unusual activity, bullish/bearish flow, whale trades, gamma squeeze, and more)
- AI feeds in one place (Commentary, Ideas, Conviction)
- Key levels from options positioning
Next: Terminal — See flow alongside price action and options-derived overlays.
Remember: Flow shows what traders are doing, not what will happen. Large trades can be hedges, spreads, or wrong. Use as one input in your analysis.