Market Sentiment Analysis
Options-based sentiment indicators
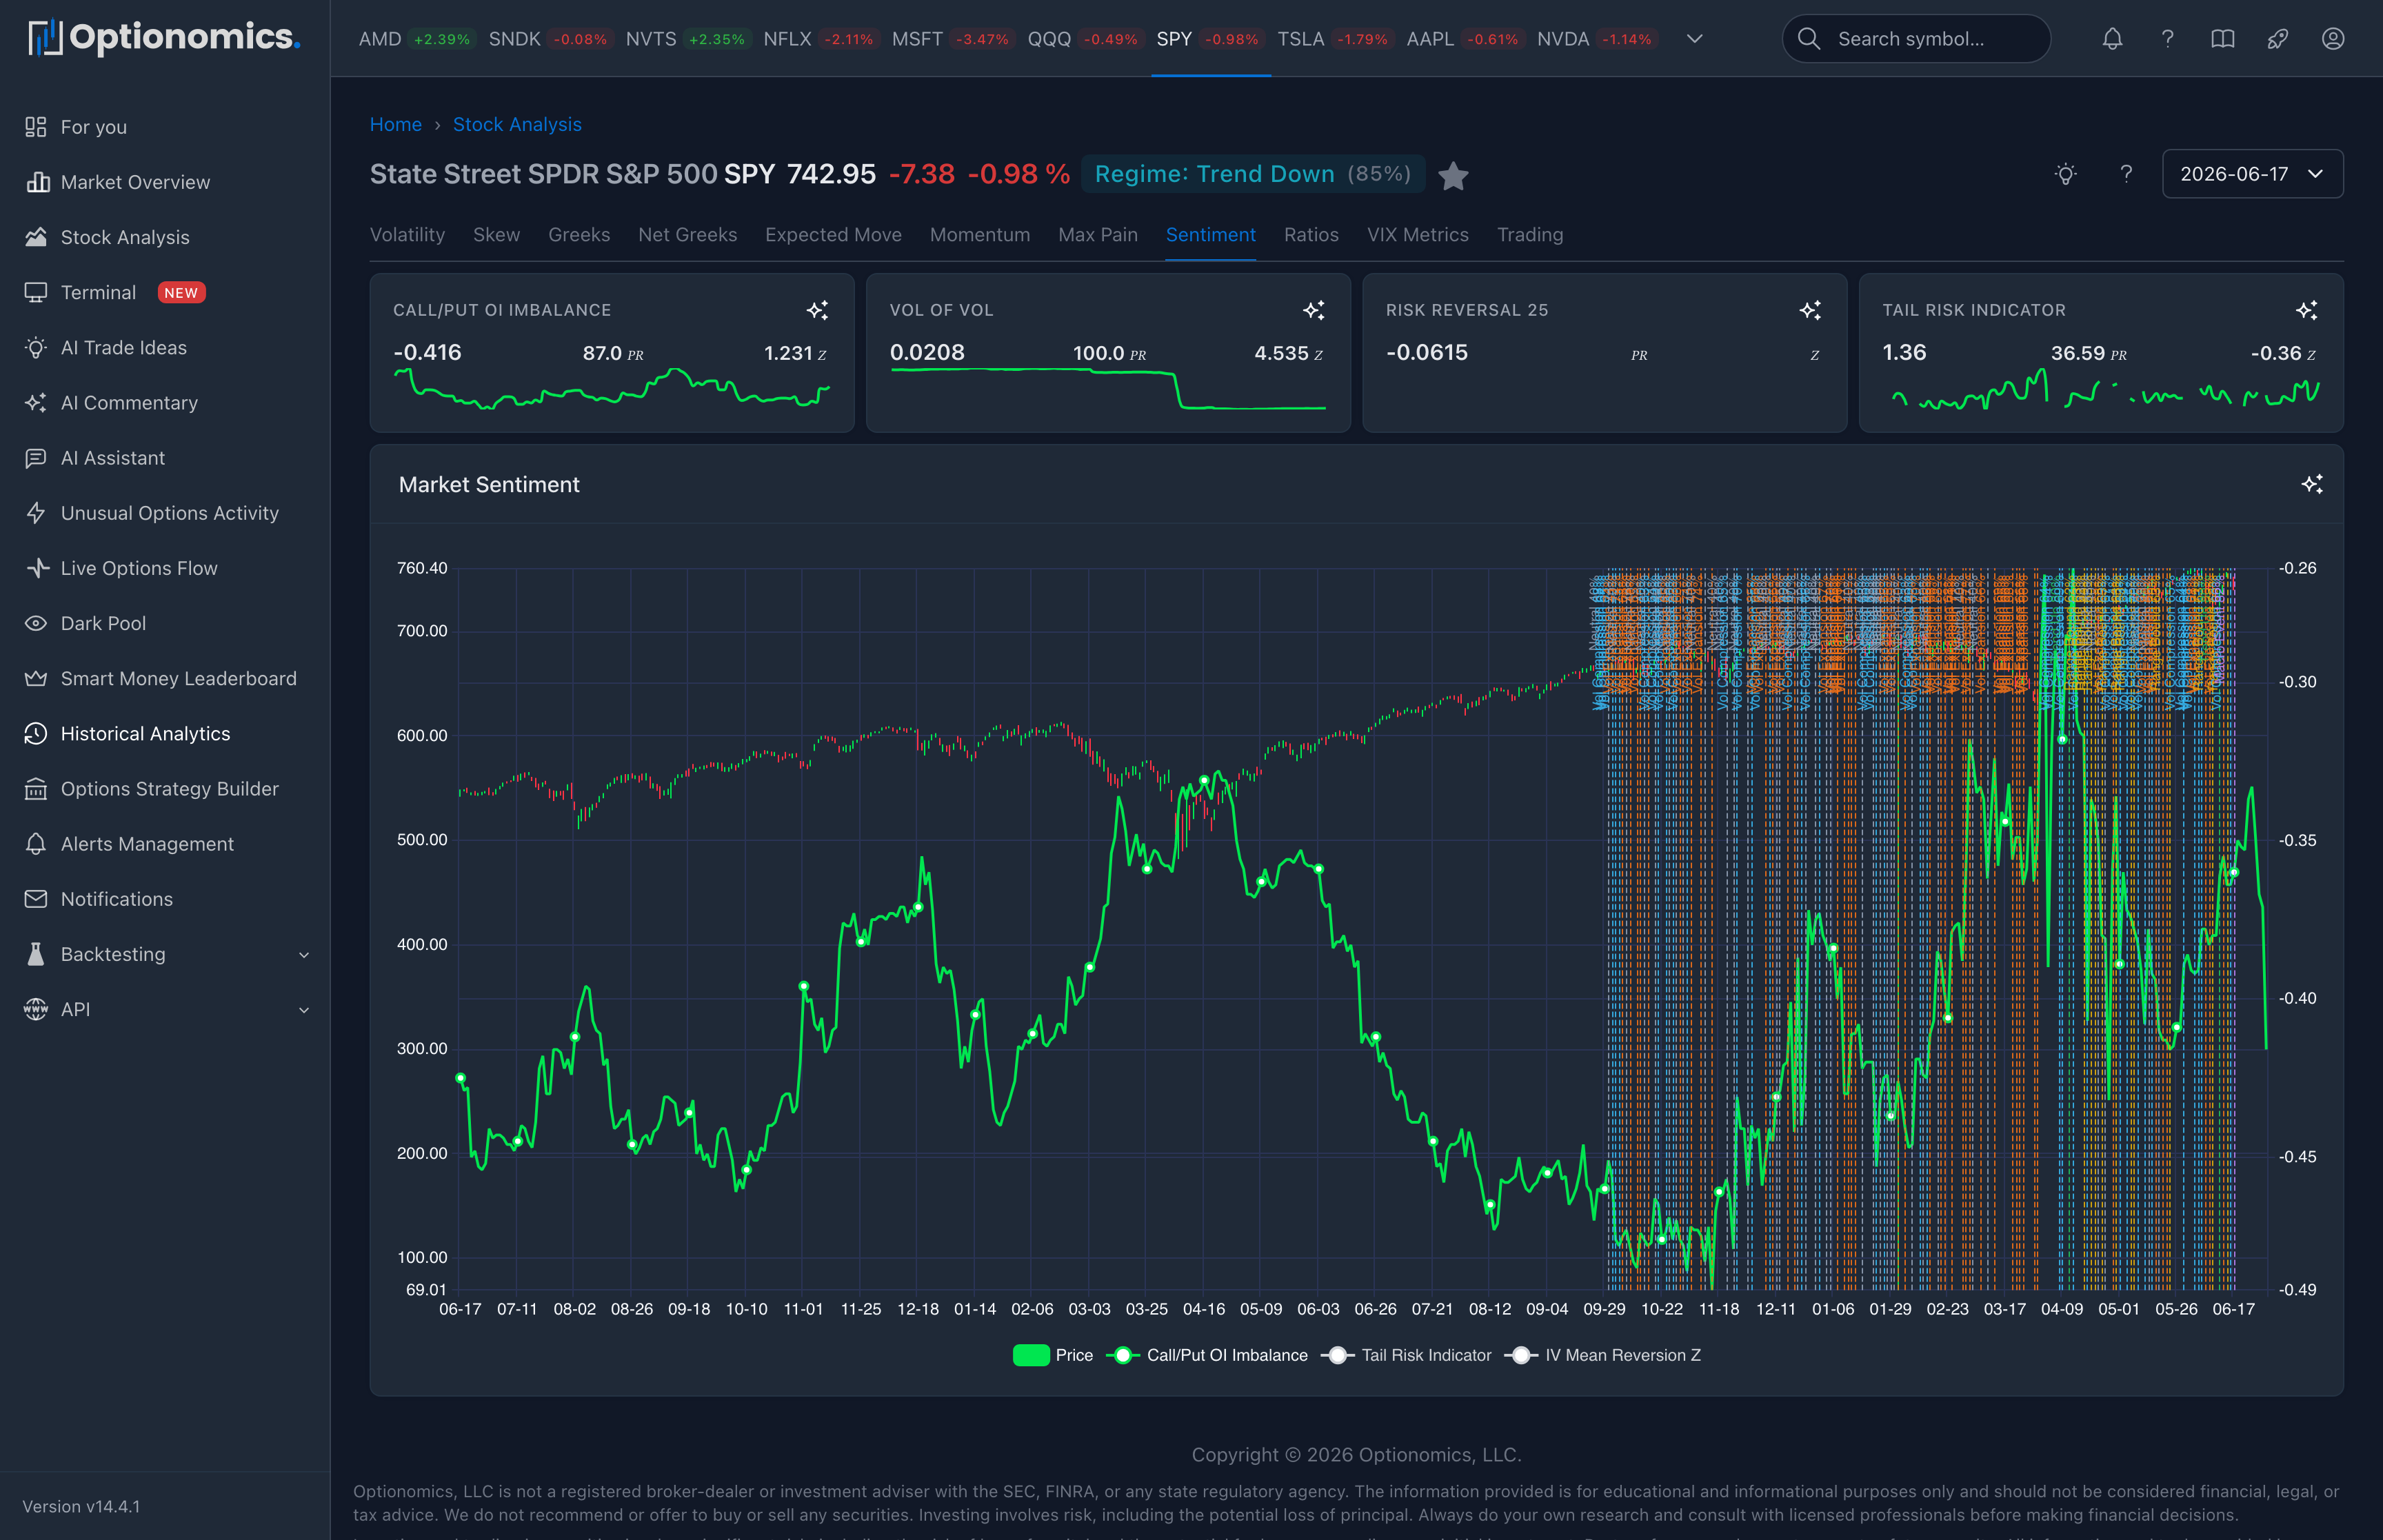
Track market sentiment through options positioning.
Sparkline Widgets
| Metric | Description |
|---|---|
| Call/Put OI Imbalance | Ratio of call to put open interest |
| Vol of Vol | Volatility of implied volatility |
| Risk Reversal 25 | IV difference between 25-delta put and call |
| Tail Risk Indicator | Measure of tail risk pricing |
Charts
Market Sentiment
- Call/Put OI Imbalance
- Vol of Vol, Risk Reversal 25
- Tail Risk Indicator, IV Mean Reversion Z
Interpreting Sentiment
| Metric | Bullish Signal | Bearish Signal |
|---|---|---|
| Call/Put OI Imbalance | High (more calls) | Low (more puts) |
| Risk Reversal 25 | Negative (calls expensive) | Positive (puts expensive) |
| Vol of Vol | Low (complacency) | High (fear) |
| Tail Risk Indicator | Low | High |
Contrarian questions
| Extreme | Question to ask |
|---|---|
| Very high call/put imbalance | Is optimism crowded, or is there strong confirmation from price and flow? |
| Very low call/put imbalance | Is fear excessive, or is the market correctly pricing new downside risk? |
| Very high tail risk | Is the market bracing for a known event, earnings, or macro shock? |
| Very low tail risk | Is complacency setting in, or is realized volatility genuinely low? |
Note: Extreme sentiment can persist. Use with other analysis.
