Terminal
One workspace for chart, flow, AI, and alerts
What the Terminal is
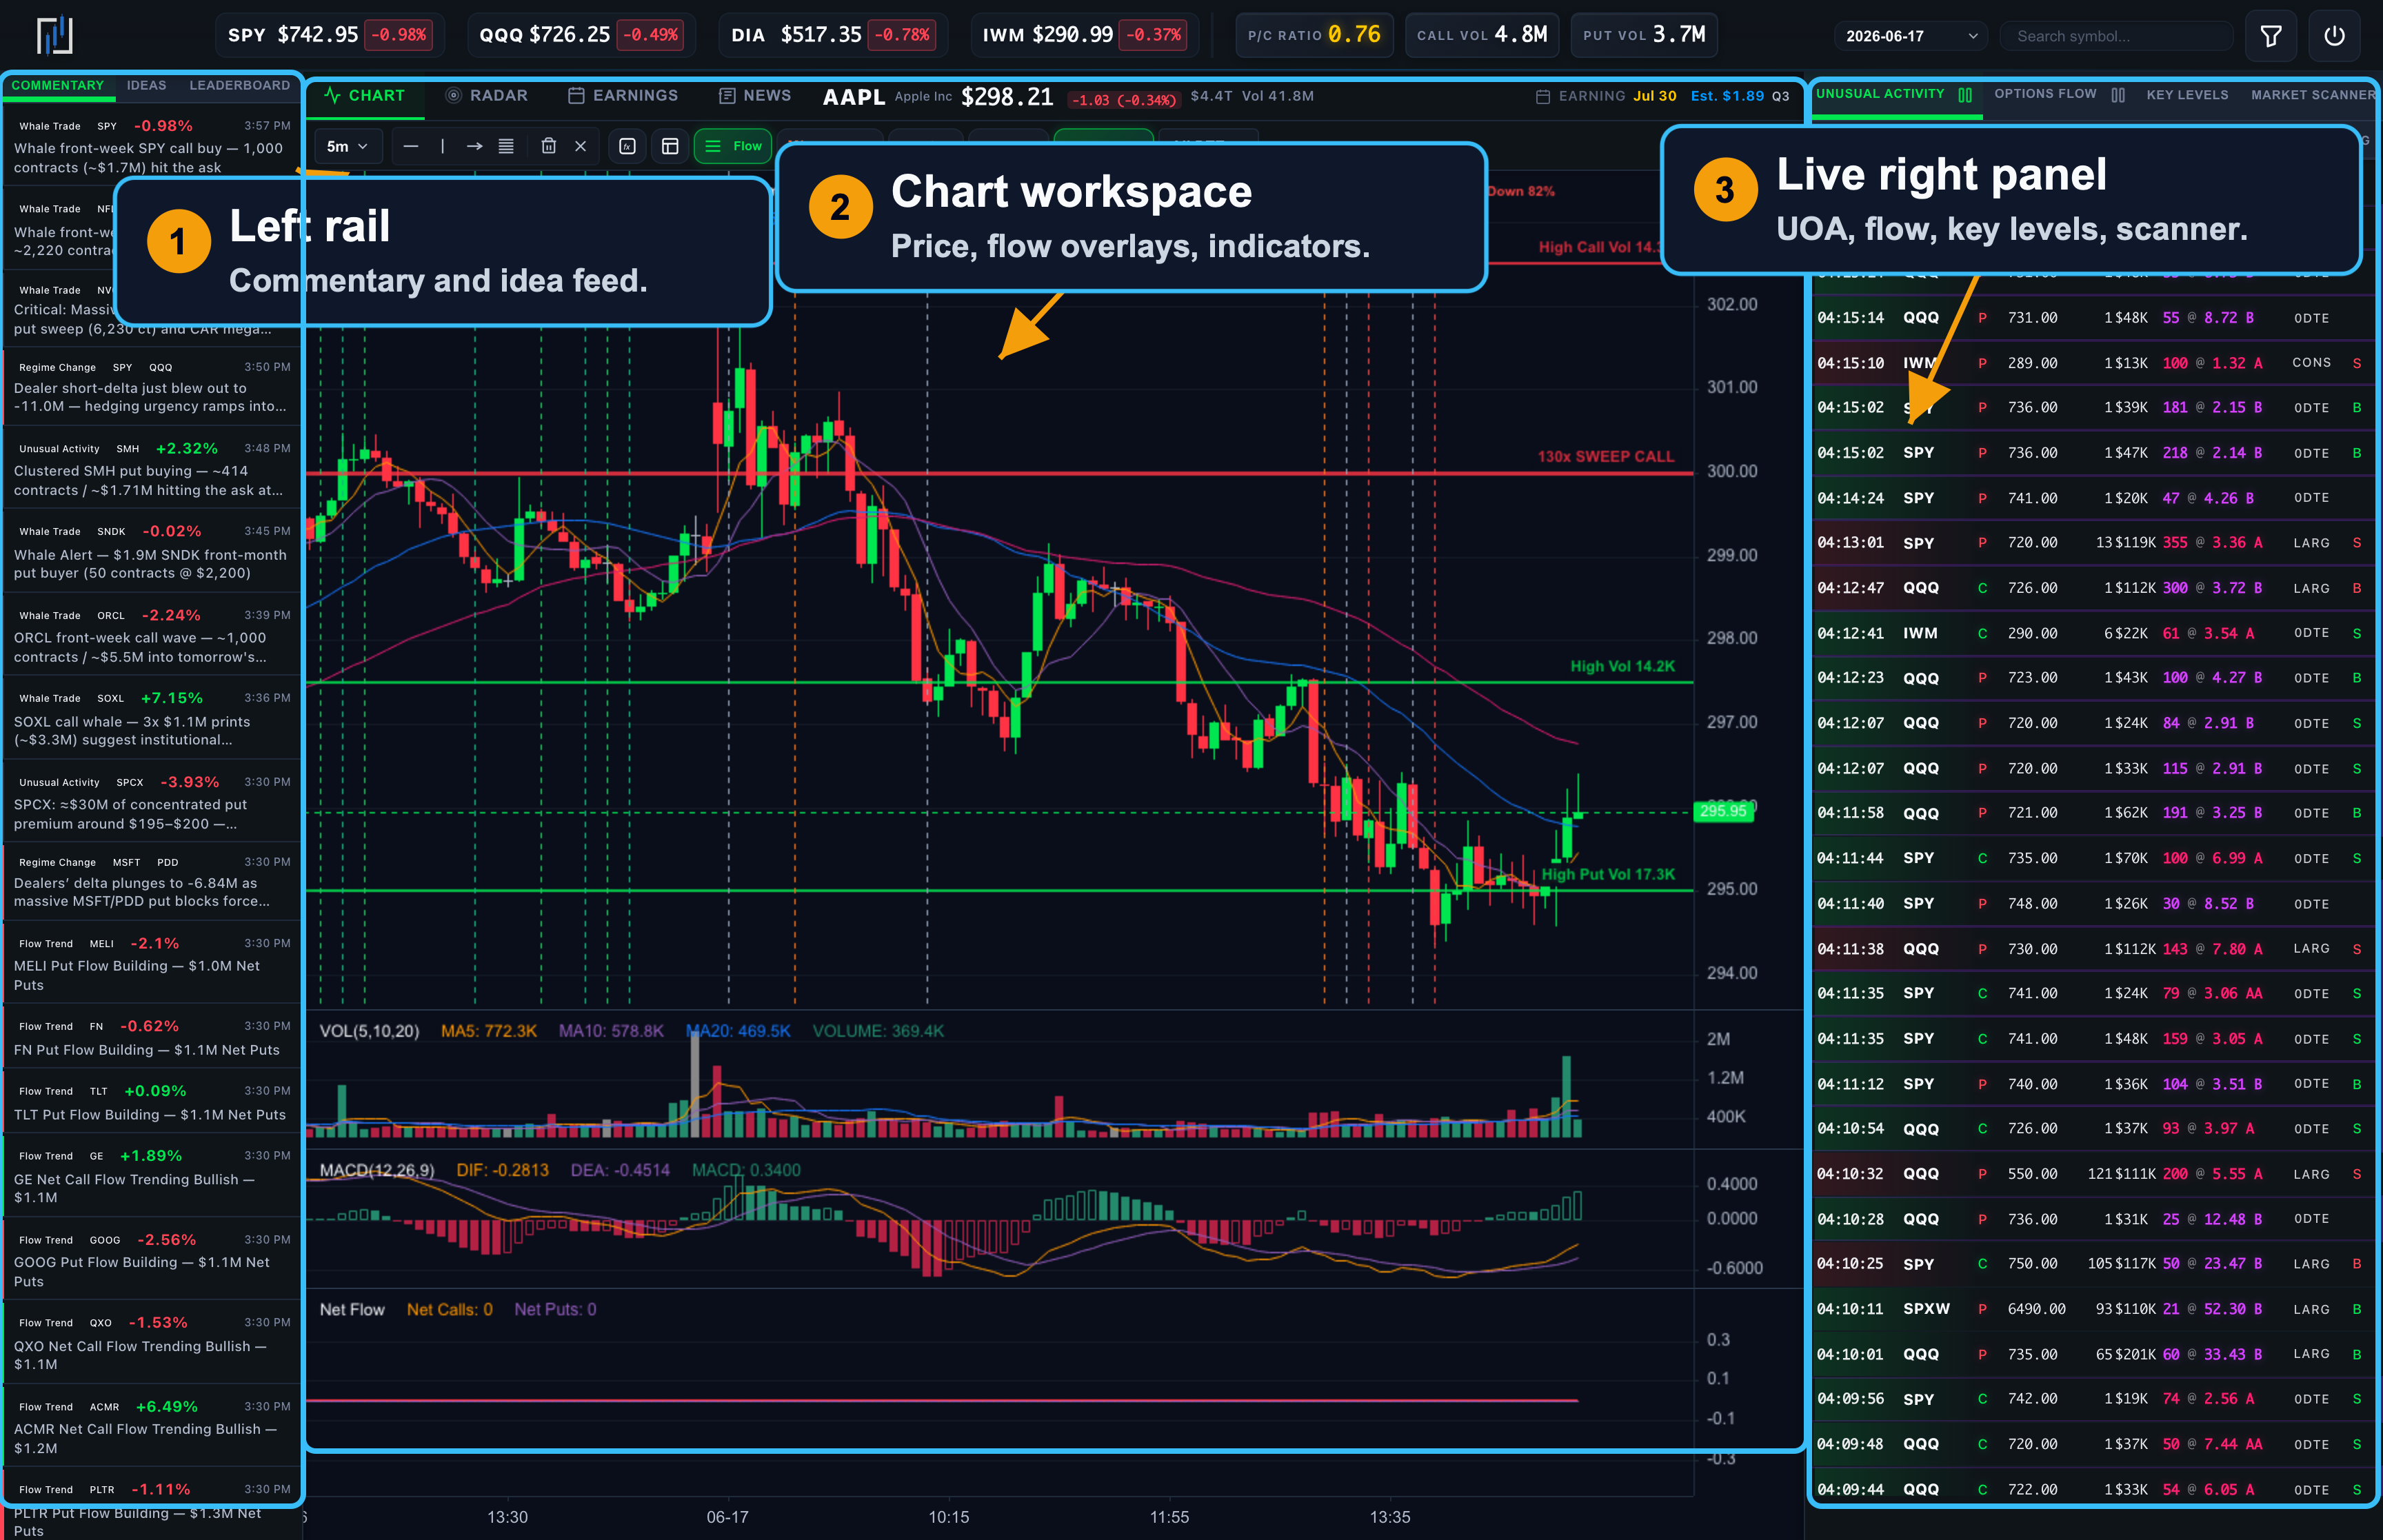
The Terminal is Optionomics’ multi-panel workspace: one browser layout where you can keep a price chart, AI feeds, live flow, unusual prints, options-derived key levels, a scanner, your watchlist, and alert notifications in sync around a single symbol without juggling a dozen tabs.
It is built for traders who want tight feedback loops during the session: change the symbol once, and the chart, flow tables, and many overlays follow. Even slower-tempo traders find it useful on earnings week or event days when context density matters.
Availability: Gamma plan and higher
Open it: Sidebar → Terminal (also at /terminal).
Layout
The Terminal is a three-column layout:
| Column | Purpose |
|---|---|
| Left — AI | Tabs for the AI feeds: Commentary, Ideas, and the Smart Money Conviction leaderboard |
| Center — Chart | The interactive chart with overlays, drawing tools, and indicators, plus tabs for Radar, Earnings, and News |
| Right — Live | Switchable live panel: Unusual Activity, Options Flow, Key Levels, Market Scanner, Watchlist, or your Alerts |
A header strip above all three carries market context (a SPY/QQQ/DIA/IWM ticker), quick market gauges, and the symbol search. An in-app Help panel inside the Terminal documents alert types and reading conventions—open it with the help button on the chart toolbar at any time.
Left column — AI feeds
The left column is a single tab strip with three AI panels:
| Tab | Content |
|---|---|
| Commentary | The live Market Commentary feed |
| Ideas | The live Trade Ideas feed, with an option-P/L row hint |
| Conviction | The day’s Smart Money Conviction leaderboard |
Click any symbol in these panels to load the chart and re-anchor the entire workspace around that name. Live price-change badges appear next to symbols so you can read direction without hopping tabs.
Center column — chart
The center column is the chart and its surrounding context tabs:
- Symbol header with current price, day’s change, next-earnings badge, and quick stock details.
- Chart toolbar with timeframes, drawing tools, indicators, and overlay toggles (flow S/R, dark pool S/R, GEX, option chain walls, net flow with a DTE filter, drawing tools, MA / EMA / BOLL / SAR / BBI, VOL / MACD / RSI / KDJ).
- Center tabs: Chart, Radar (a structural snapshot of the symbol’s options activity), Earnings, and News (a per-symbol news feed with sentiment hints).
Hovering an option contract row in the flow panels shows a quick price-chart preview for that contract after a brief dwell, so you can scan without a second click.
Right column — switchable live panel
The right column is the live part of the workspace and switches between six tabs:
| Tab | Content |
|---|---|
| Unusual Activity | Live unusual options activity prints, with Pause/Play |
| Options Flow | The live options flow tape, with Pause/Play |
| Key Levels | Stocks approaching critical options-derived levels (call walls, put walls, max pain, high-OI strikes), with distance and expiry |
| Market Scanner | A preset-based scanner: Unusual Activity, Bullish Flow, Bearish Flow, IV Extremes, Gamma Squeeze, Whale Trades, Institutional, Vol Crush, and Dark Pool Convergence |
| Watch List | Your watchlist with live price percent changes |
| Alerts | Your Notifications inbox—delivered alerts from your custom rules, with a link to Manage Alerts |
The Pause / Play controls on Unusual Activity and Options Flow let you stop the live stream so you can read a row without it scrolling away, then resume.
Active filters set on Unusual Activity or Options Flow show as chips above the panel; remove them individually or clear them all at once.
Filters and modals
The Terminal has its own Filter modal for the live right-panel streams—symbol, strike, expiration, option type, premium minimum, sweep / block flags, and alert type. Set strict filters during heavy sessions to keep noise down.
Other modals available from the chart toolbar / header:
- Indicator modal — toggle main-chart and sub-chart indicators.
- Heatmaps modal — a strike-by-expiration heatmap for the current symbol, switchable between Net Flow, GEX, Vanna, Charm, Volume, OI, and Premium.
- Help modal — in-app guide that documents the flow table, sentiment colors, alert types, and badges.
A typical intraday workflow
- Set the symbol from search, watchlist, or a row in the AI side panels so all panels align.
- Glance at market gauges and Commentary to read the broad tape.
- Scan AI tabs (Conviction, Ideas) for candidates that already have weight behind them.
- Turn on chart overlays that match your plan (for example flow S/R + net flow + GEX) to see whether price is interacting with where options activity clustered.
- Use Unusual Activity and Options Flow tabs on the right for live evidence; Key Levels for what to watch into the close.
- Use Alerts as a paper trail of what already fired for your rules.
You don’t need every tab every day; most traders live in chart + one AI tab + one right-panel tab.
Differences vs the standalone pages
The Terminal shares data with the standalone pages but adds:
- A single symbol context that ties chart and side panels together.
- A live right panel that you can switch without losing the chart.
- Pause / Play on the live streams.
- An in-app help panel tuned to the Terminal layout.
For deep, sortable, filterable lists (full-page Unusual Activity, full-page Options Flow, full-page Smart Money), open those pages directly from the sidebar.
Related: Options Flow · Smart Money · Trade Ideas · Market Commentary · Alerts Management · Notifications
Note: The Terminal displays real-time data for informational purposes. Options trading involves substantial risk.