Historical Options Analytics
Study the past to understand the present
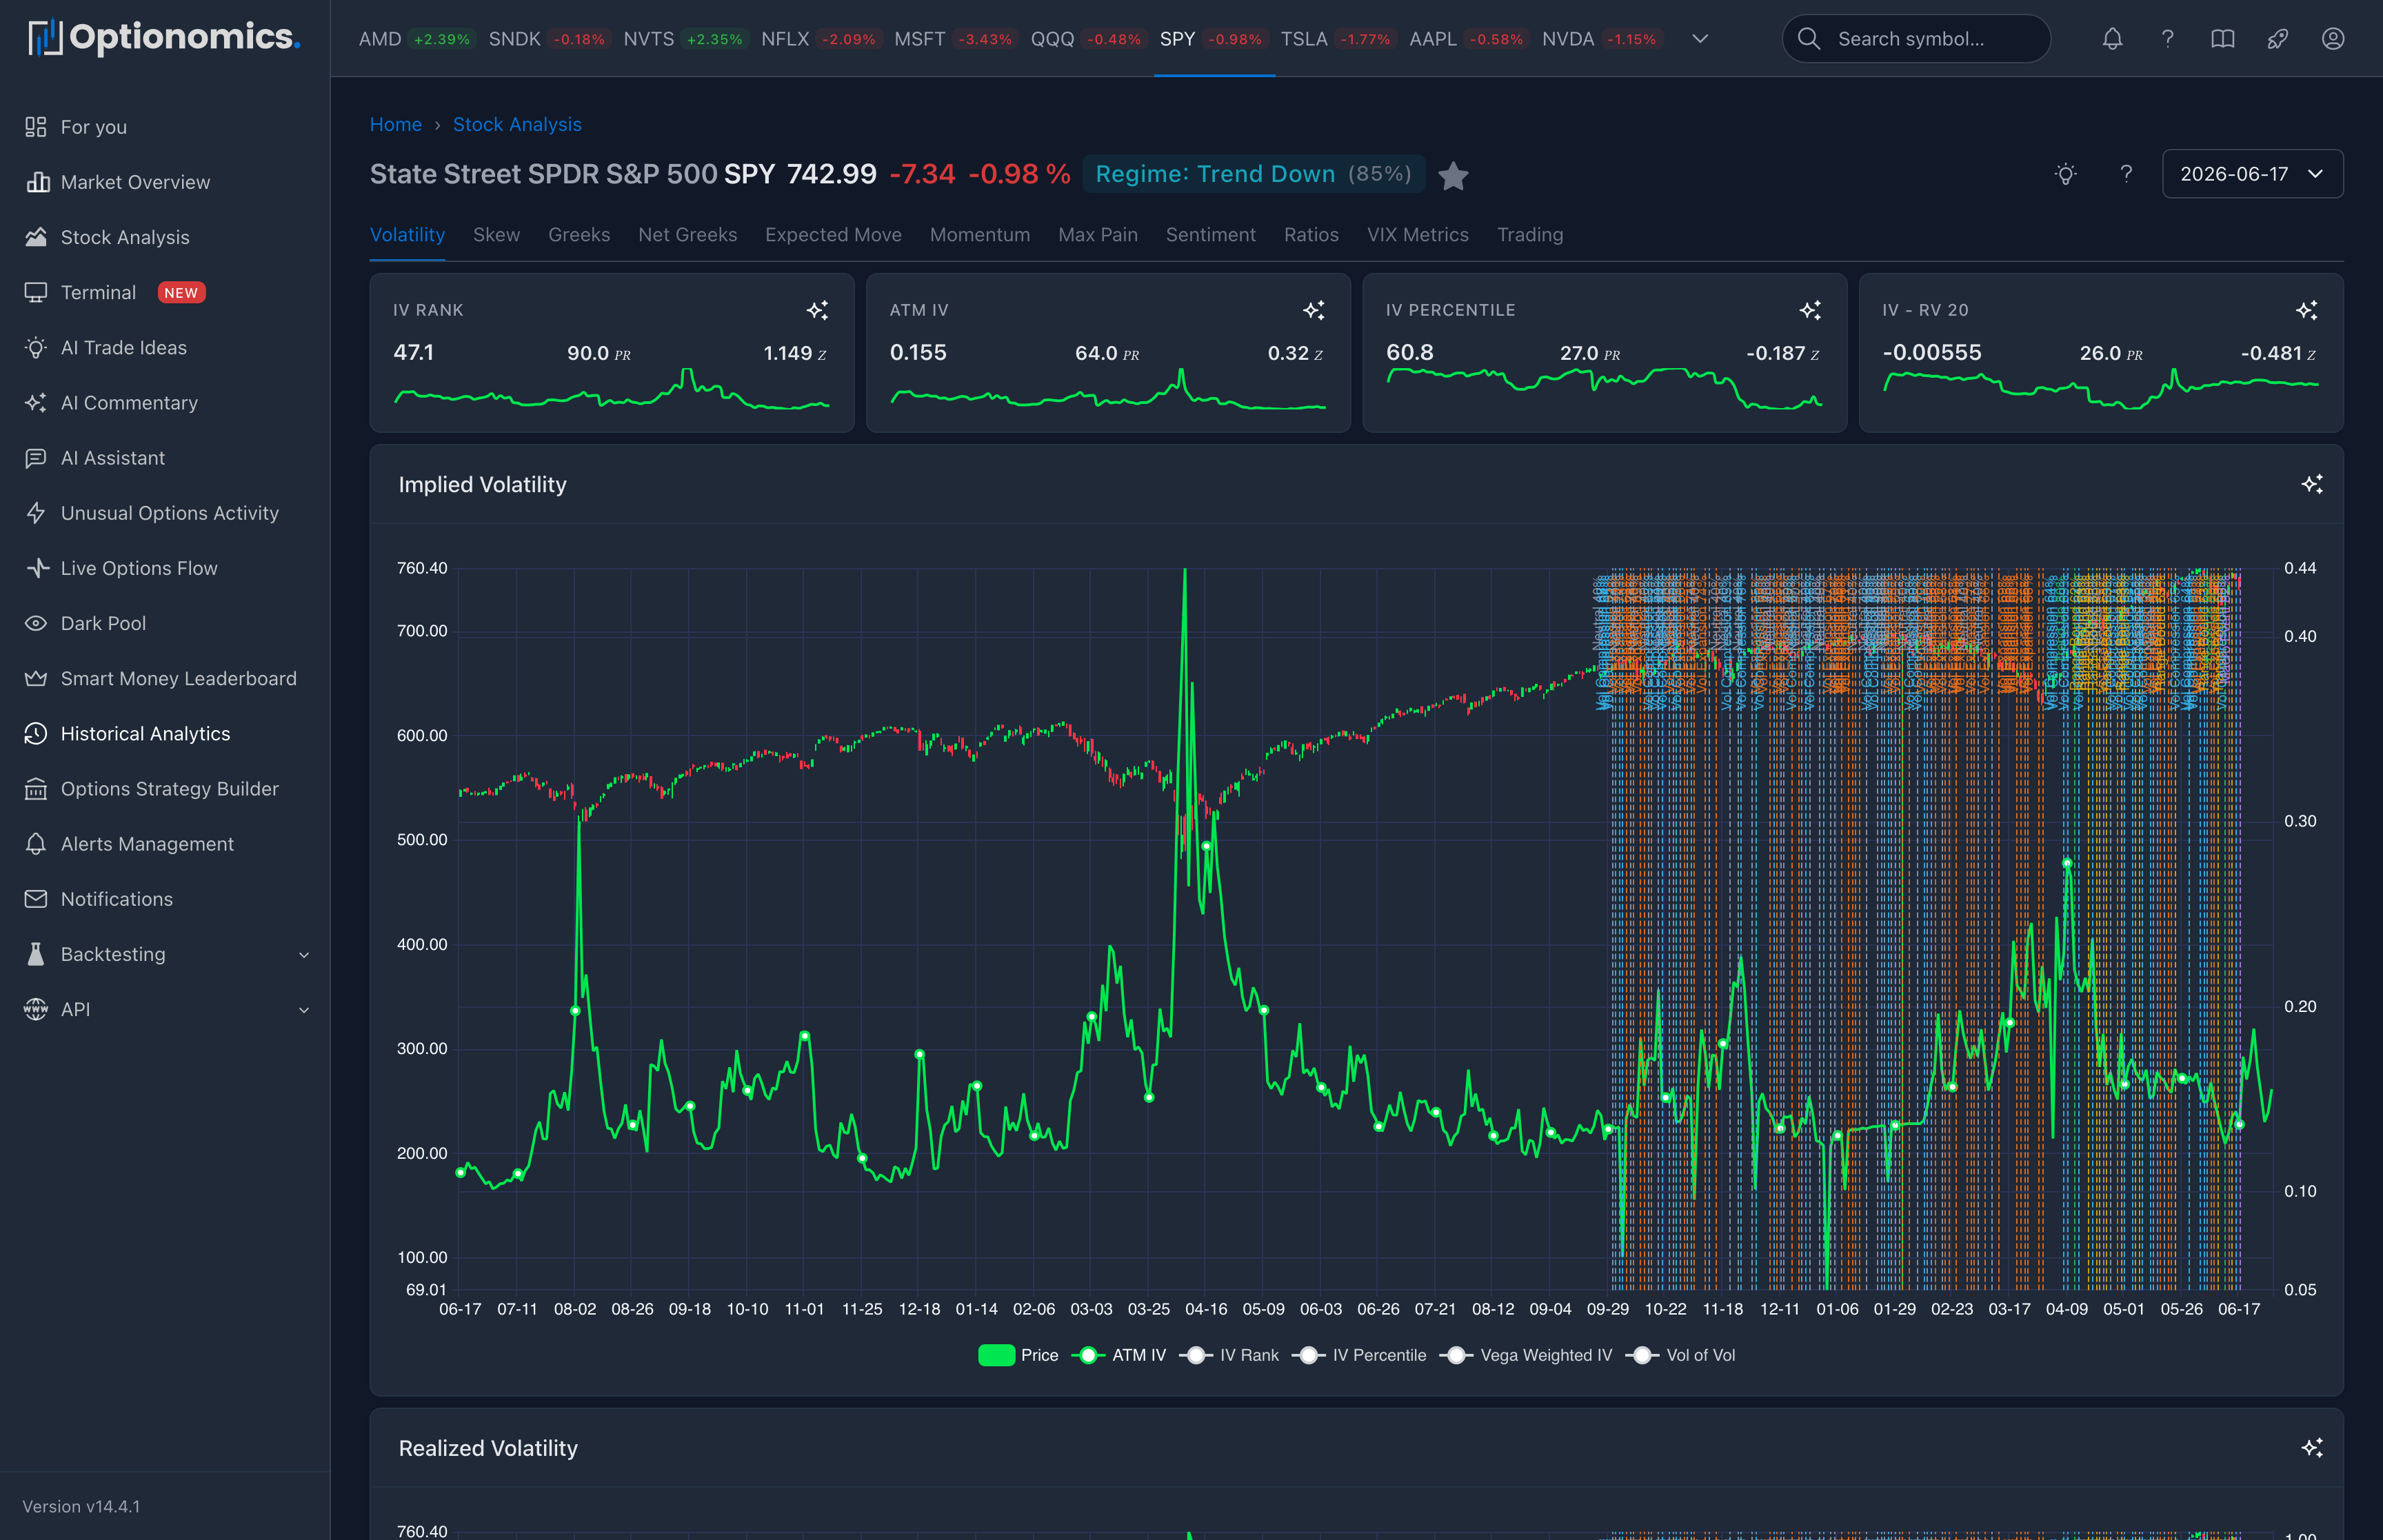
What historical analytics add
Daily analytics give you a snapshot for a single date: where positioning and volatility sit right now (or on a date you pick). Historical analytics string those concepts across weeks, months, or years: How did IV rank behave into the last three earnings cycles? Did skew flip before the big drawdown? When GEX flipped sign, what did spot do next?
This area is for context and discipline: checking whether today’s readings are normal, stretched, or unprecedented for that name; studying how sentiment and ratios trended; and comparing expected move to realized outcomes over many events. It complements—does not replace—your own journal and fundamental work.
Availability: All plans (Delta and higher)
Who uses it most: Swing traders and volatility traders sanity-checking entries; risk managers stress-testing assumptions; anyone building playbooks (“what usually happens when IV percentile is above 90% here?”).
The 11 Historical Charts
| Chart | What It Answers |
|---|---|
| Volatility Metrics | Is IV high or low historically? |
| Skew & Term Structure | How has risk pricing changed? |
| Delta & Gamma Exposure | How did GEX/DDE evolve? |
| Net Greeks | What’s the aggregate positioning? |
| Expected Move | Did IV predict actual moves? |
| Market Momentum | Is momentum building or fading? |
| Max Pain | Where did price finish vs max pain? |
| Market Sentiment | What’s the crowd thinking? |
| Put/Call Ratios | How has sentiment shifted? |
| VIX-Style Metrics | Stock-specific volatility index |
| Trading & Arbitrage | Premium flow and yield metrics |
Date Range Selection
| Range | Best For |
|---|---|
| 3 months | Recent trends |
| 6 months | Medium-term patterns |
| 1 year | Full market cycle |
| 2 years | Extended analysis (default) |
Key Features
Data Visualization
| Feature | Description | Use Case |
|---|---|---|
| Price Overlay | Stock price shown alongside options metrics | Correlate options data with price action |
| Statistical Rankings | Percentile and Z-score calculations | Identify extreme readings |
| Trend Indicators | Moving averages and momentum signals | Spot trend changes early |
| Sparkline Widgets | Mini charts for quick metrics | At-a-glance current values |
| Multi-Metric Charts | Multiple data series on one chart | Compare related metrics |
| AI Analysis | Click ✨ for instant explanations | Understand complex patterns |
Statistical Metrics Explained
IV Rank (0-100%):
- Compares current IV to its 52-week range
- 80%+ = IV near historical high (expensive options)
- 20%- = IV near historical low (cheap options)
IV Percentile (0-100%):
- Shows percentage of days where IV was lower than today
- More robust than IV Rank (not affected by single spike)
Z-Score:
- Measures how many standard deviations from the mean
- +2 = Two standard deviations above mean (very high)
- -2 = Two standard deviations below mean (very low)
- 0 = At the mean (average)
Chart Types
Sparklines: Quick reference mini-charts
- Show current value and trend
- No axes for clean appearance
- Perfect for dashboards
Candlestick Charts: Detailed time series
- OHLC data for each period
- Volume bars at bottom
- Multiple overlays available
Line Charts: Trend visualization
- Clean, simple trend lines
- Multiple series comparison
- Statistical overlays (MA, bands)
Rank Charts: Percentile tracking
- Shows relative positioning
- Color-coded zones (high/low)
- Historical context
Use Cases & Examples
Volatility Trading
Goal: Find optimal times to sell/buy premium
Workflow:
- Check IV Rank chart (target 80%+ for selling, 20%- for buying)
- Review IV Percentile for confirmation
- Compare IV to Realized Volatility (IV-RV spread)
- Check Vol of Vol (stable = better for selling)
- Review historical IV mean reversion patterns
Example Strategy:
- IV Rank >80% + IV > RV20 = evaluate defined-risk premium-selling structures
- IV Rank <20% + IV < RV20 = evaluate long-volatility structures
Event Analysis (Earnings)
Goal: Understand typical earnings patterns
Workflow:
- Load 2-year history including past earnings
- Mark earnings dates on charts
- Study IV behavior 30 days before/after
- Analyze GEX changes around earnings
- Review sentiment shifts (P/C ratios)
Typical Pattern:
- IV rises 30 days before earnings
- GEX increases (positioning)
- IV crushes 30-50% post-earnings
- GEX normalizes within days
Sentiment Tracking
Goal: Identify extreme sentiment for contrarian plays
Workflow:
- Monitor Put/Call ratio charts
- Check sentiment analysis indicators
- Review risk reversal (25-delta)
- Track tail risk indicator
- Compare to historical extremes
Contrarian Signals:
- P/C Ratio >1.5 = Extreme fear (possible reversal context)
- P/C Ratio <0.5 = Extreme greed (possible exhaustion context)
- Tail Risk >90th percentile = Elevated fear (review event and hedge demand)
Risk Assessment
Goal: Understand current volatility regime
Workflow:
- Check VIX 30d and VIX Rank
- Review term structure slope
- Analyze gamma exposure trends
- Check vol of vol (volatility stability)
- Compare to historical regimes
Regime Classification:
- Low Vol: VIX <15, Positive GEX, Low Vol of Vol
- Normal: VIX 15-25, Mixed GEX, Moderate Vol of Vol
- High Vol: VIX 25-35, Negative GEX, High Vol of Vol
- Crisis: VIX >35, Very Negative GEX, Extreme Vol of Vol
Pattern Learning
Goal: Study what happened before major moves
Example Questions:
- “What did GEX look like before that gamma squeeze?”
- “How did skew behave before the crash?”
- “What was P/C ratio at the top?”
- “Did IV predict the actual move?”
Research Workflow:
- Identify the event date
- Load 6-month history centered on event
- Review all 11 chart categories
- Note patterns in 30 days before event
- Document findings for future reference
Backtesting Ideas
Goal: Validate trading strategies historically
Workflow:
- Define entry criteria (e.g., IV Rank >80)
- Define exit criteria (e.g., IV Rank <50)
- Scan historical charts for matches
- Note outcomes (profit/loss)
- Calculate win rate and average return
Example Backtest:
- Strategy: Sell 30-delta strangles when IV Rank >75
- Exit: Close at 50% profit or IV Rank <40
- Review: Check all instances in past 2 years
- Result: Document win rate, avg return, max loss
How to Navigate
Quick Start
- Search for a stock symbol
- Select “Historical Analytics” from sidebar
- Choose from 11 chart categories
- Adjust date range (3mo, 6mo, 1yr, 2yr)
- Analyze patterns and trends
Advanced Navigation
Compare Multiple Timeframes:
- Open multiple browser tabs
- Set different date ranges
- Compare patterns across periods
Pro Tips
- Start with sparklines: Get quick overview of all metrics
- Drill into details: Click sparkline to see full chart
- Use date range shortcuts: Quick access to common periods
- Compare to price: Always overlay stock price for context
- Check multiple stocks: Compare patterns across similar stocks
- Note correlations: How do metrics relate to each other?
- Document patterns: Save screenshots of interesting patterns
- Set reminders: Note when to check back (e.g., before earnings)
Remember: Historical patterns are probabilities, not certainties. Markets evolve. Past performance doesn’t guarantee future results.