Market Momentum Indicators
Options-based momentum indicators
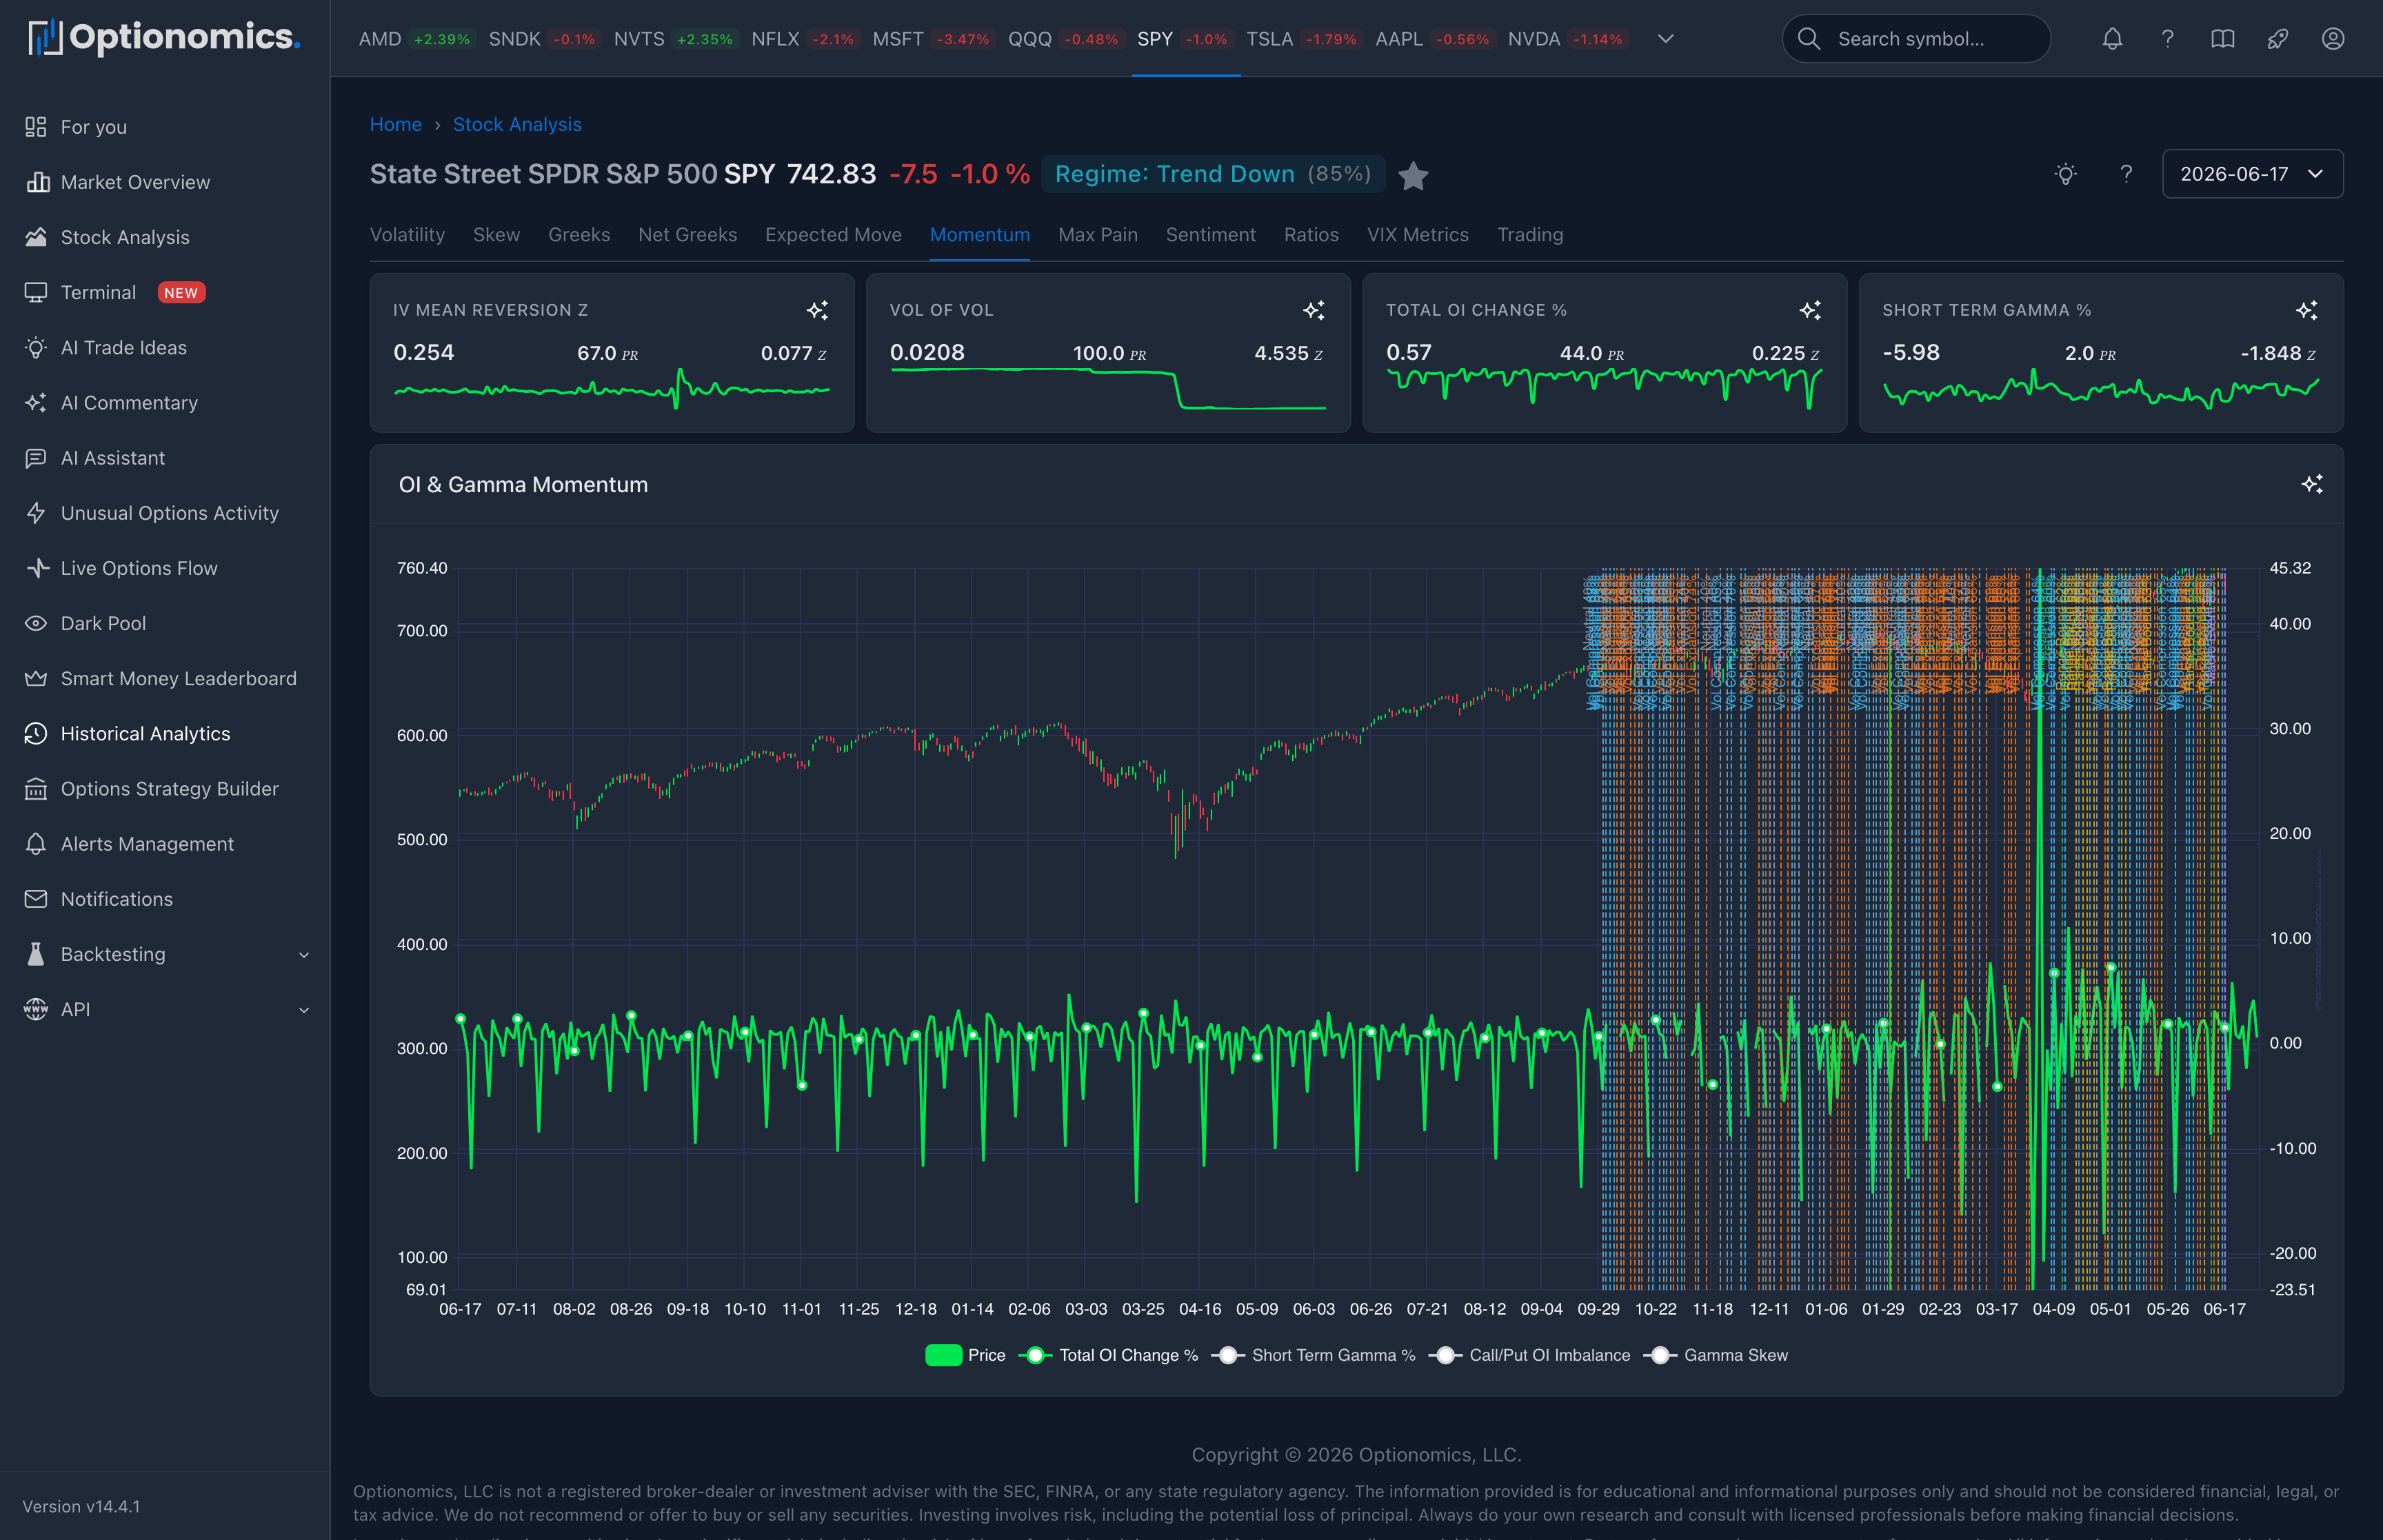
Track options-based momentum indicators over time.
Sparkline Widgets
| Metric | Description |
|---|---|
| IV Mean Reversion Z | How far IV is from its mean (Z-score) |
| Vol of Vol | Volatility of implied volatility |
| Total OI Change % | Percentage change in total open interest |
| Short Term Gamma % | Percentage of gamma in near-term expirations |
Charts
Volatility Momentum
- IV Mean Reversion Z, Vol of Vol
- IV Skew Z Score, Tail Risk Indicator
OI & Gamma Momentum
- Total OI Change %
- Short Term Gamma %
- Call/Put OI Imbalance, Gamma Skew
Interpreting Momentum
| Metric | Low Value | High Value |
|---|---|---|
| IV Mean Reversion Z | IV below average (potential rise) | IV above average (potential fall) |
| Vol of Vol | Stable volatility | Volatile volatility (uncertainty) |
| Total OI Change % | Declining interest | Growing interest |
| Short Term Gamma % | Long-dated focus | Near-term focus (event-driven) |
Trading Applications
| Observation | Implication |
|---|---|
| High IV Mean Reversion Z | IV is stretched above its norm—evaluate premium-selling setups carefully |
| Low IV Mean Reversion Z | IV is stretched below its norm—evaluate long-volatility setups carefully |
| Rising OI Change % | New positions being built |
| High Short Term Gamma % | Near-term event expected |
Note: Momentum indicators show trends, not predictions. Reversals can occur.
