Unusual Options Activity
Trades that stand out from the crowd
What Unusual Options Activity is for
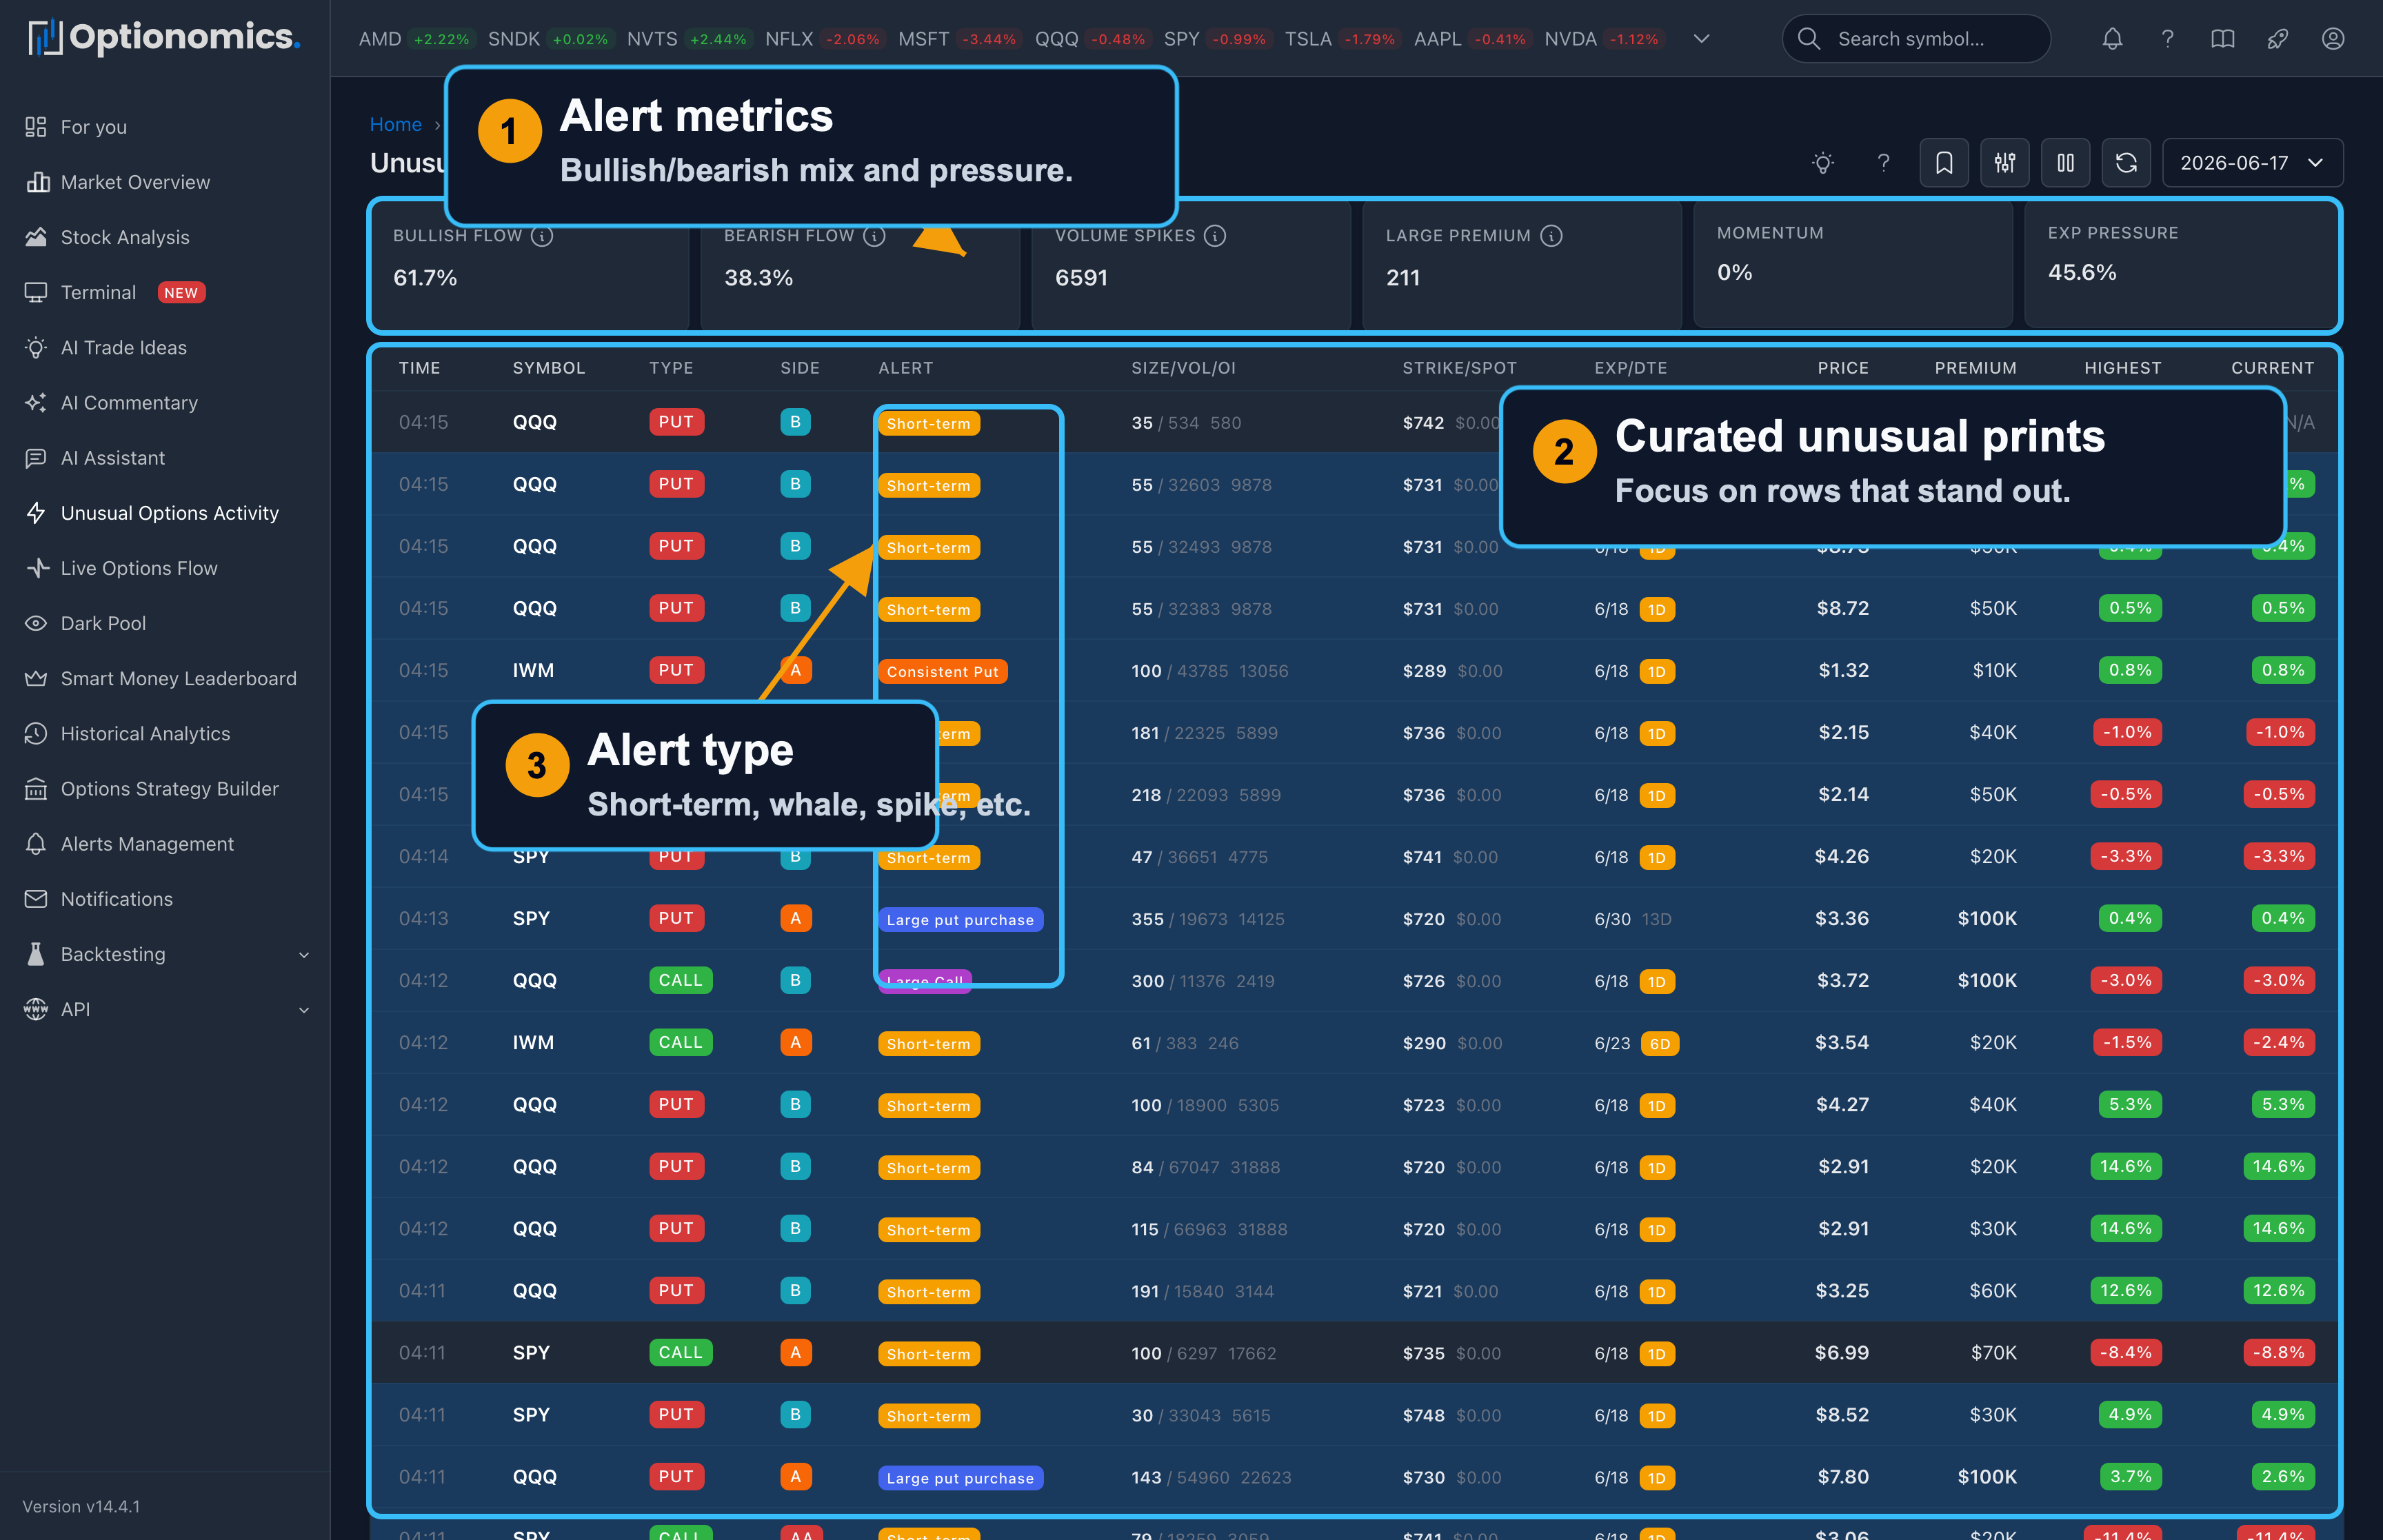
The Live Options Flow page is the full tape: every print you are allowed to see, as fast as it arrives. Unusual Options Activity is the curated view: trades and patterns that score high against historical and cross-sectional norms, so you spend less time scrolling and more time on prints that often (not always) matter for positioning, events, or follow-up research.
Think of it as a priority queue for the options market: size, premium, how the trade was worked, how it compares to open interest, and whether it matches known alert types (whale, aggressive buy, volume spike, and so on) all feed into an unusual score you can sort and filter on.
Availability: Gamma plan and higher ($59/month+)
How this page fits with the rest of the product
| You want to… | Start here |
|---|---|
| See every trade and build your own mental filter | Live Options Flow |
| Focus on scored unusual prints and alert taxonomies | This page (Unusual Options Activity) |
| See conviction-ranked symbols today across flow, dark pool, alerts, and Greeks | Smart Money Conviction |
| Get notified when criteria match | Alerts Management |
| See flow on the chart | Terminal |
Suggested workflow: Use Unusual Activity to shortlist names, then open each symbol’s daily or historical analytics, news, and the full chain so you understand structure (single leg vs spread, hedge vs speculation) before you act.
The live stream
Above the alerts table, the Pause / Play button stops or resumes the live stream so you can read a row without it scrolling away. Filters narrow the table by symbol, premium, score, alert type, and more, and a date selector (Time Travel) lets you review a prior session’s alerts.
Saved Views: save a filter combination you use often as a named view and reapply it in one click.
How We Detect Unusual Activity
Every trade is compared with market context for that symbol and contract. The score considers signals such as:
| Factor | What to look for |
|---|---|
| Size | Contracts that stand out versus normal activity for that option |
| Premium | Large dollar value relative to the symbol and expiry |
| Execution | Whether buyers or sellers appeared willing to cross the spread |
| Volume/OI relationship | Fresh volume that looks large compared with existing open interest |
| Timing | Concentrated activity in a short window |
| Historical context | Activity that differs from the symbol’s usual baseline |
| Order style | Sweeps, blocks, and other trade labels that help describe urgency or size |
| Strike and expiry selection | Clustering around notable strikes, expiries, or moneyness levels |
Alert Types
Each unusual trade is classified into one or more types. The main families:
| Family | Example types | What it means |
|---|---|---|
| Whale trades | Premium ≥$500K or very large contract counts | Institutional-scale positioning |
| Directional momentum | Swift / steady / large bullish or bearish flow | One side of the tape pressing with urgency, persistence, or size |
| Aggressive execution | Aggressive call buying, aggressive put buying | Paying up at or above the ask for direction |
| Accumulation patterns | Consistent call buying, consistent put buying, repeated activity | The same trade signature recurring within a short window |
| Large single prints | Large call purchase, large put purchase, sweep orders | One outsized print worth a look on its own |
| Volume and volatility | Volume spike (size vs open interest), IV / volatility spike | New positioning or volatility expansion |
| Near-term activity | Short-term options activity (low DTE with size) | Positioning into an imminent event |
| Multi-leg structures | Vertical spreads, straddles, strangles, condors, unusual spreads | Defined-risk or volatility structures detected across legs |
| Statistical anomalies | Flow imbalance, contextual outlier, structural flow anomaly | Prints that deviate sharply from the symbol’s historical baseline |
The exact mix adapts by symbol and market conditions. A print that is routine for a mega-cap may be exceptional for a smaller name.
Unusual Score
The unusual score (0-100) is a priority signal, not a prediction:
| Score range | How to use it |
|---|---|
| 90-100 | Highest-priority prints. Review quickly and cross-check news, charts, and chain context. |
| 80-89 | Strongly unusual activity that usually deserves a closer look. |
| 70-79 | Notable activity that may be useful with symbol, expiry, and event context. |
| 60-69 | Moderately unusual. Use additional filters before spending time on it. |
| Below 60 | Lower-priority activity. Often best used only when it matches a symbol or setup you already follow. |
Dashboard Metrics
| Metric | Description |
|---|---|
| Bullish/Bearish Flow | % of unusual activity by direction |
| Volume Spikes | Count of volume spike alerts |
| Large Premium | Count of big dollar trades |
| Momentum | Intraday momentum % |
| Exp Pressure | % of alerts expiring soon |
Quick Filters
| Filter | Shows |
|---|---|
| High Score | Score ≥80, Premium ≥$500K |
| Whale Trades | Only whale alerts |
| Volume Spikes | Only volume spike alerts |
| Aggressive Buying | Aggressive call buying |
| No ETFs | Exclude ETF/index options |
Important Context
Not all unusual activity is what it seems—the score measures statistical rarity and execution urgency, not “smart money is always right.”
- A large put buy may hedge a long stock book, an index portfolio, or a short call position—not a simple bearish bet on the name.
- A large sale at the bid can be closing a long, opening a short, or unwinding one leg of a spread; the tape alone rarely proves which.
- You typically see one contract line; multi-leg packages may not resolve into a single clean narrative without chain and time context.
- ETFs and indices often dominate flow for macro hedging; filters like “No ETFs” exist so you can focus on single names when that matches your process.
Always cross-check: corporate calendar (earnings, dividends, splits), headlines, key prices from gamma exposure or your own levels, and whether realized vol is expanding or compressing.
Remember: Unusual activity is market intelligence, not a trading signal. Use it to ask better questions and allocate attention; combine it with risk limits, position sizing, and your own thesis before committing capital.