Options Flow Chart
Price action with options-derived overlays, drawings, and indicators
What this chart is
Live Options Flow answers “what printed?” in table form. The Options Flow Chart answers “how does price relate to options-derived levels and to aggressive premium through the session?” It’s the Chart tab on every stock page and the center column of the Terminal, built on a fast interactive engine with intraday timeframes, drawing tools, technical indicators, and the options-specific overlays that make Optionomics distinctive.
Use it when a name is active and you care about timing—opening drives, lunch lulls, last-hour gamma effects—or when you want a persistent canvas for a stock you’re tracking through the day.
Availability: Most overlays available on Gamma+; the ML overlay requires a plan with ML features (Theta+).
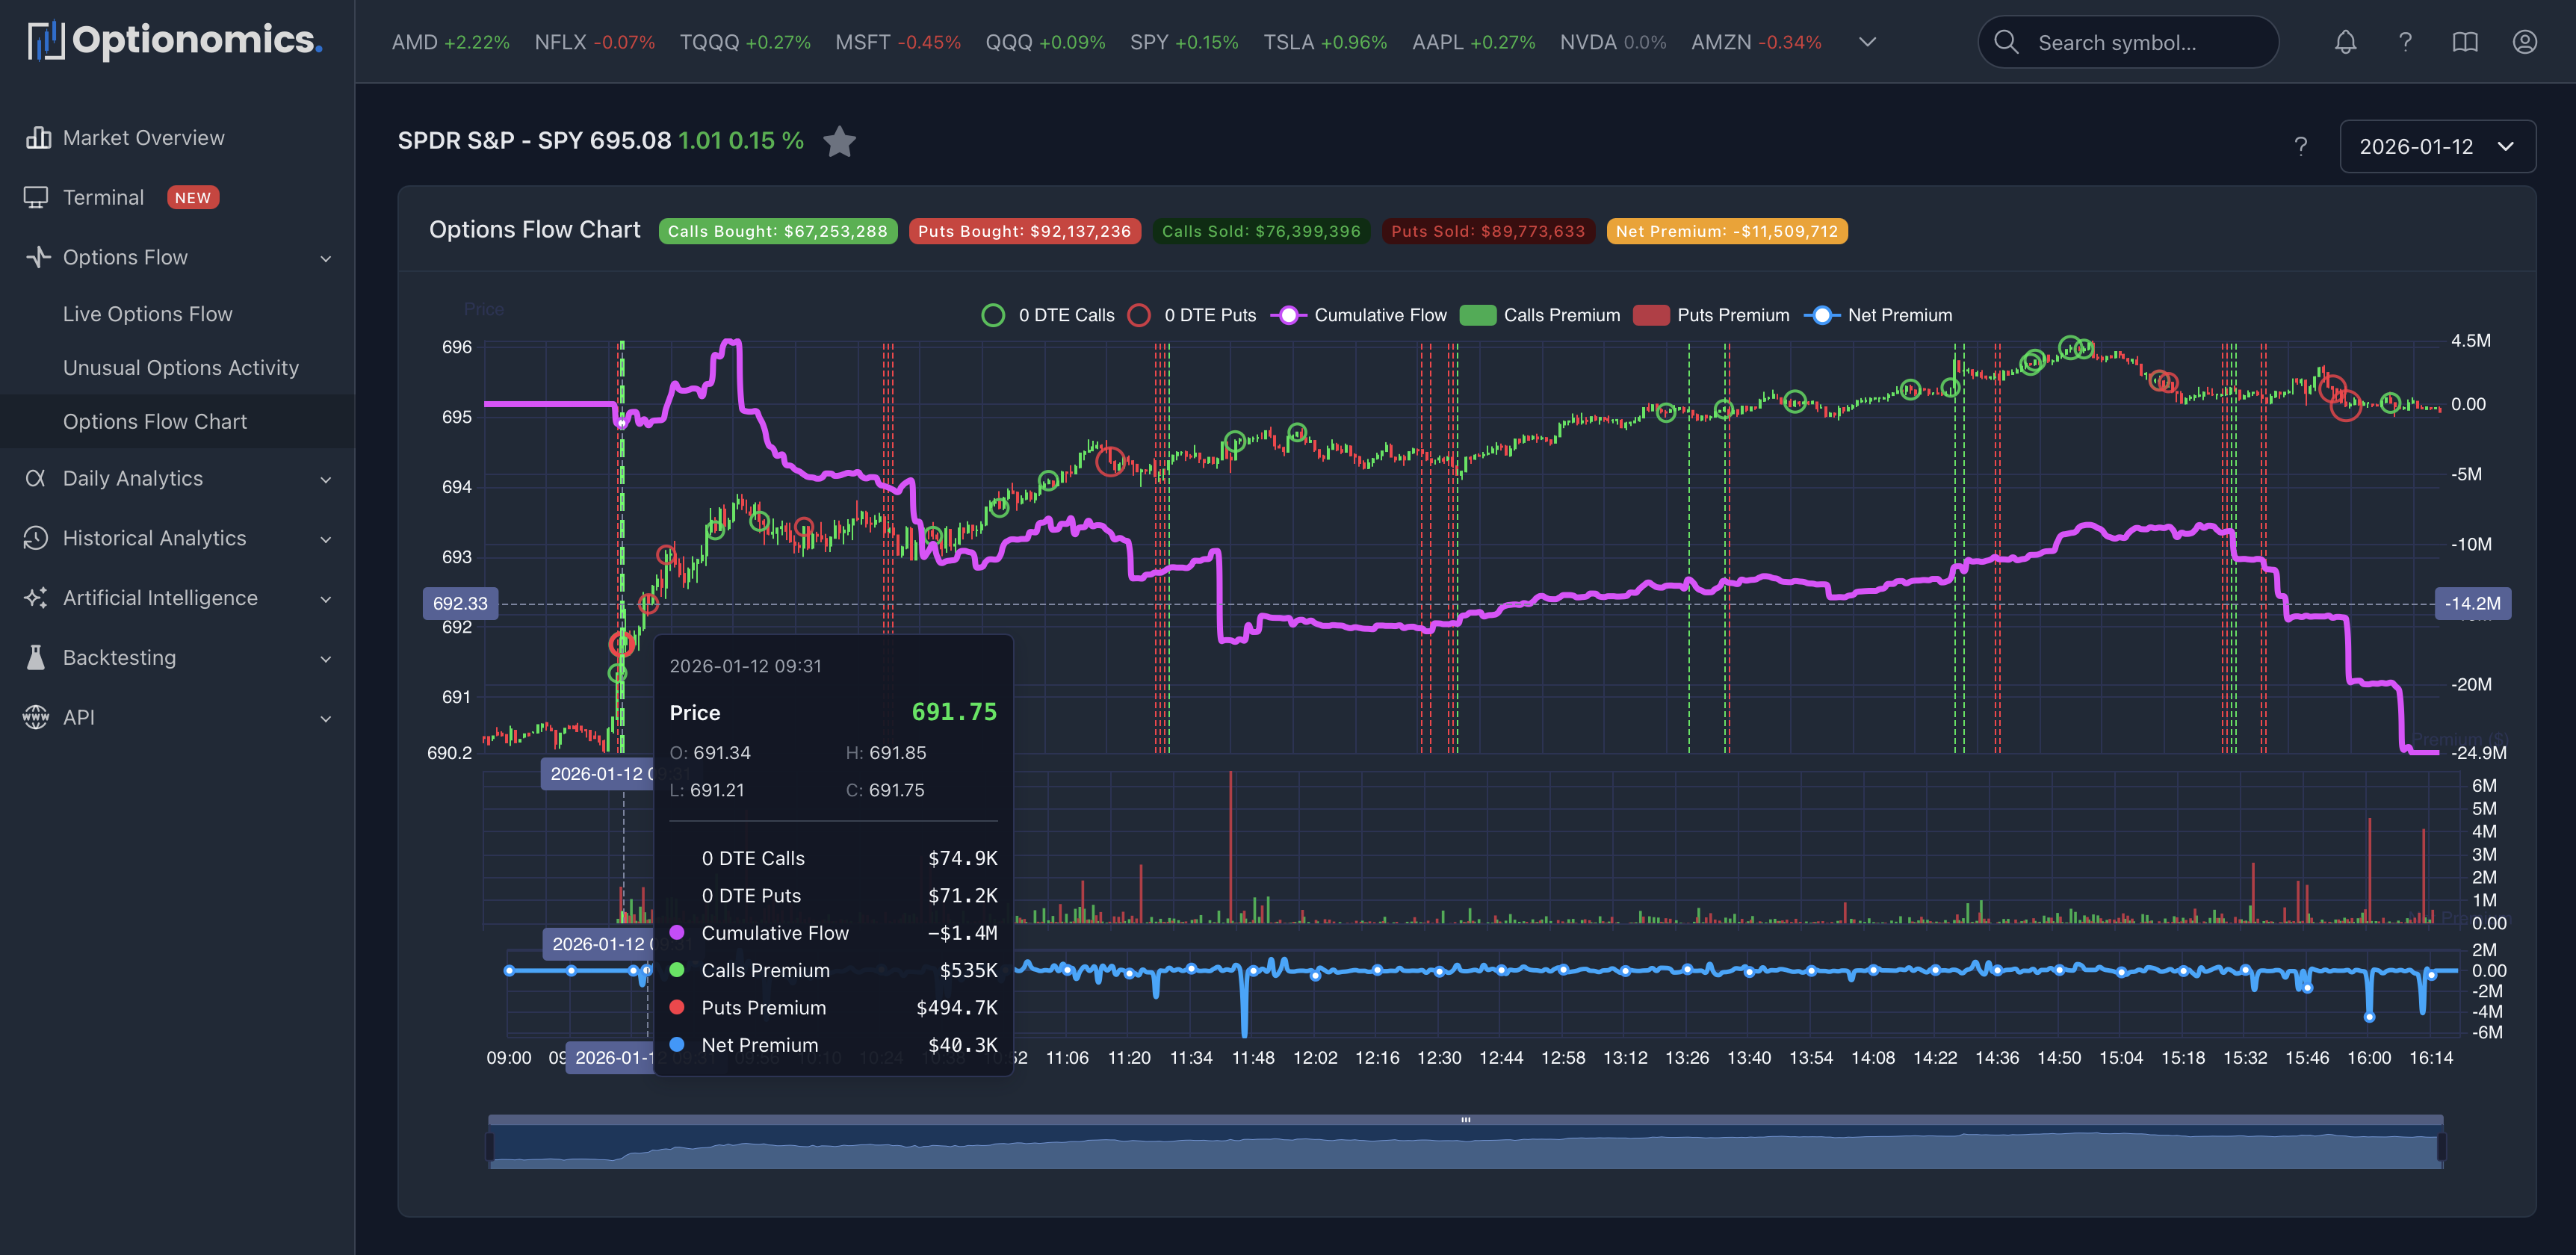
Premium summary header
Above the chart you’ll see a strip of premium badges for the day, plus a quick Terminal shortcut to open this symbol in the multi-panel workspace.
| Badge | Meaning |
|---|---|
| Calls Bought | Premium on call purchases at/above ask |
| Puts Bought | Premium on put purchases at/above ask |
| Calls Sold | Premium on call sales at/below bid |
| Puts Sold | Premium on put sales at/below bid |
| Net Premium | Calls minus puts (color-coded) |
Timeframes
Switch the chart with one click:
- Intraday: 1m, 5m, 15m, 30m, 1H, 2H, 4H
- Daily and longer: D (daily), W (weekly), M (monthly)
Options-specific overlays
The toolbar exposes toggle buttons for each overlay—turn on what you want, leave the rest off.
| Toggle | Overlay |
|---|---|
| S/R | Support and resistance derived from options flow clustering |
| DP | Support and resistance derived from dark pool block prints |
| GEX | Gamma exposure markers from current positioning |
| OC | Option-chain–derived support and resistance levels |
| ML | Machine-learning support and resistance |
| Flow | Net flow overlay on the price chart |
Each overlay is independent. Turn on S/R + DP + GEX when you want confluence between options-derived levels and dark-pool memory. Turn on Flow when you want to see cumulative directional pressure through the day next to candles.
Drawing tools
A separate group on the toolbar handles drawings:
| Tool | Use |
|---|---|
| Horizontal line | Mark a flat level (target, stop, key strike) |
| Vertical line | Mark a time of day or event |
| Ray line | Anchor a sloped line from a point |
| Fibonacci retracement (Fib) | Snap fibs across a swing |
| Undo last | Remove the last drawing you placed |
| Clear all | Wipe drawings on the current symbol |
Drawings persist on the chart while you stay on the page; for permanent notes, your own trade journal is still the source of truth.
Technical indicators
Open the Ind menu on the toolbar to toggle indicators on or off. Indicators split into two areas:
| Area | Available |
|---|---|
| Main chart overlays | MA, EMA, BBOL (Bollinger Bands), SAR (Parabolic SAR), BBI (Bull-Bear Index) |
| Sub-panel indicators | VOL (Volume), MACD, RSI, KDJ |
You can stack overlays on the price pane and stack sub-indicators below the price pane. The chart adjusts layout automatically.
Reading the flow line and the premium badges together
| Pattern | What it may suggest | Confidence |
|---|---|---|
| Net flow rising while price rises | Options-driven momentum | Higher |
| Net flow rising while price drops | Hedging into weakness or contrarian setup | Mixed |
| Net flow flat while price moves | Move not confirmed by options conviction | Lower |
| Heavy flow at S/R or DP level | Defended or attacked level | Higher |
| Net Premium positive but small | Mild directional tilt | Lower |
| Net Premium strongly negative on a green candle | Calls being sold or puts being bought into strength | Mixed |
Working with overlays in practice
A few field-tested combinations:
| Goal | Overlays |
|---|---|
| Read the level structure quickly | S/R + OC |
| Add equity-side memory | S/R + OC + DP |
| Read dealer impact | GEX + OC |
| Pair structure with momentum | S/R + Flow |
| Add ML context | Above sets + ML |
If the chart starts to feel busy, turn overlays off until only the ones you’re actually reading remain. The toolbar makes this a single click each.
Date selection (Time Travel)
The stock-page header date selector applies to the daily-positioning tabs. The Chart tab itself defaults to the live session—switch tabs to the daily charts when you want to study a prior date.
Important context
- The chart shows association in time, not proof of causation. Flow can lead, lag, or diverge from spot for good reasons (spreads, hedges, vol trading).
- ML and options-derived levels are probabilistic outputs—use them as inputs, not as triggers.
- Drawings are local to the chart; they are not synced to other devices or shared.
Remember: Treat strong patterns as hypotheses to validate with the chain, news, and your risk plan—not as automatic entries.
Related: