Earnings Analysis
AI summaries, financial story charts, and filing history
What the Earnings tab is
The Earnings tab on a stock page turns each new earnings filing into something you can actually read in two minutes: an executive summary, side-by-side highlights and risks, the reported metrics vs estimates, forward guidance when the company provides it, and a deep financial story of charts that connect the latest quarter to the prior trend.
Optionomics ingests new earnings filings shortly after they are made publicly available and runs them through an analysis pipeline so that, by the time you open the tab, you usually find a structured page rather than a wall of legalese. A link back to the source filing is always provided.
Availability: Theta and Vega plans
Open it: From any stock page, click the Earnings tab in the sub-navigation.
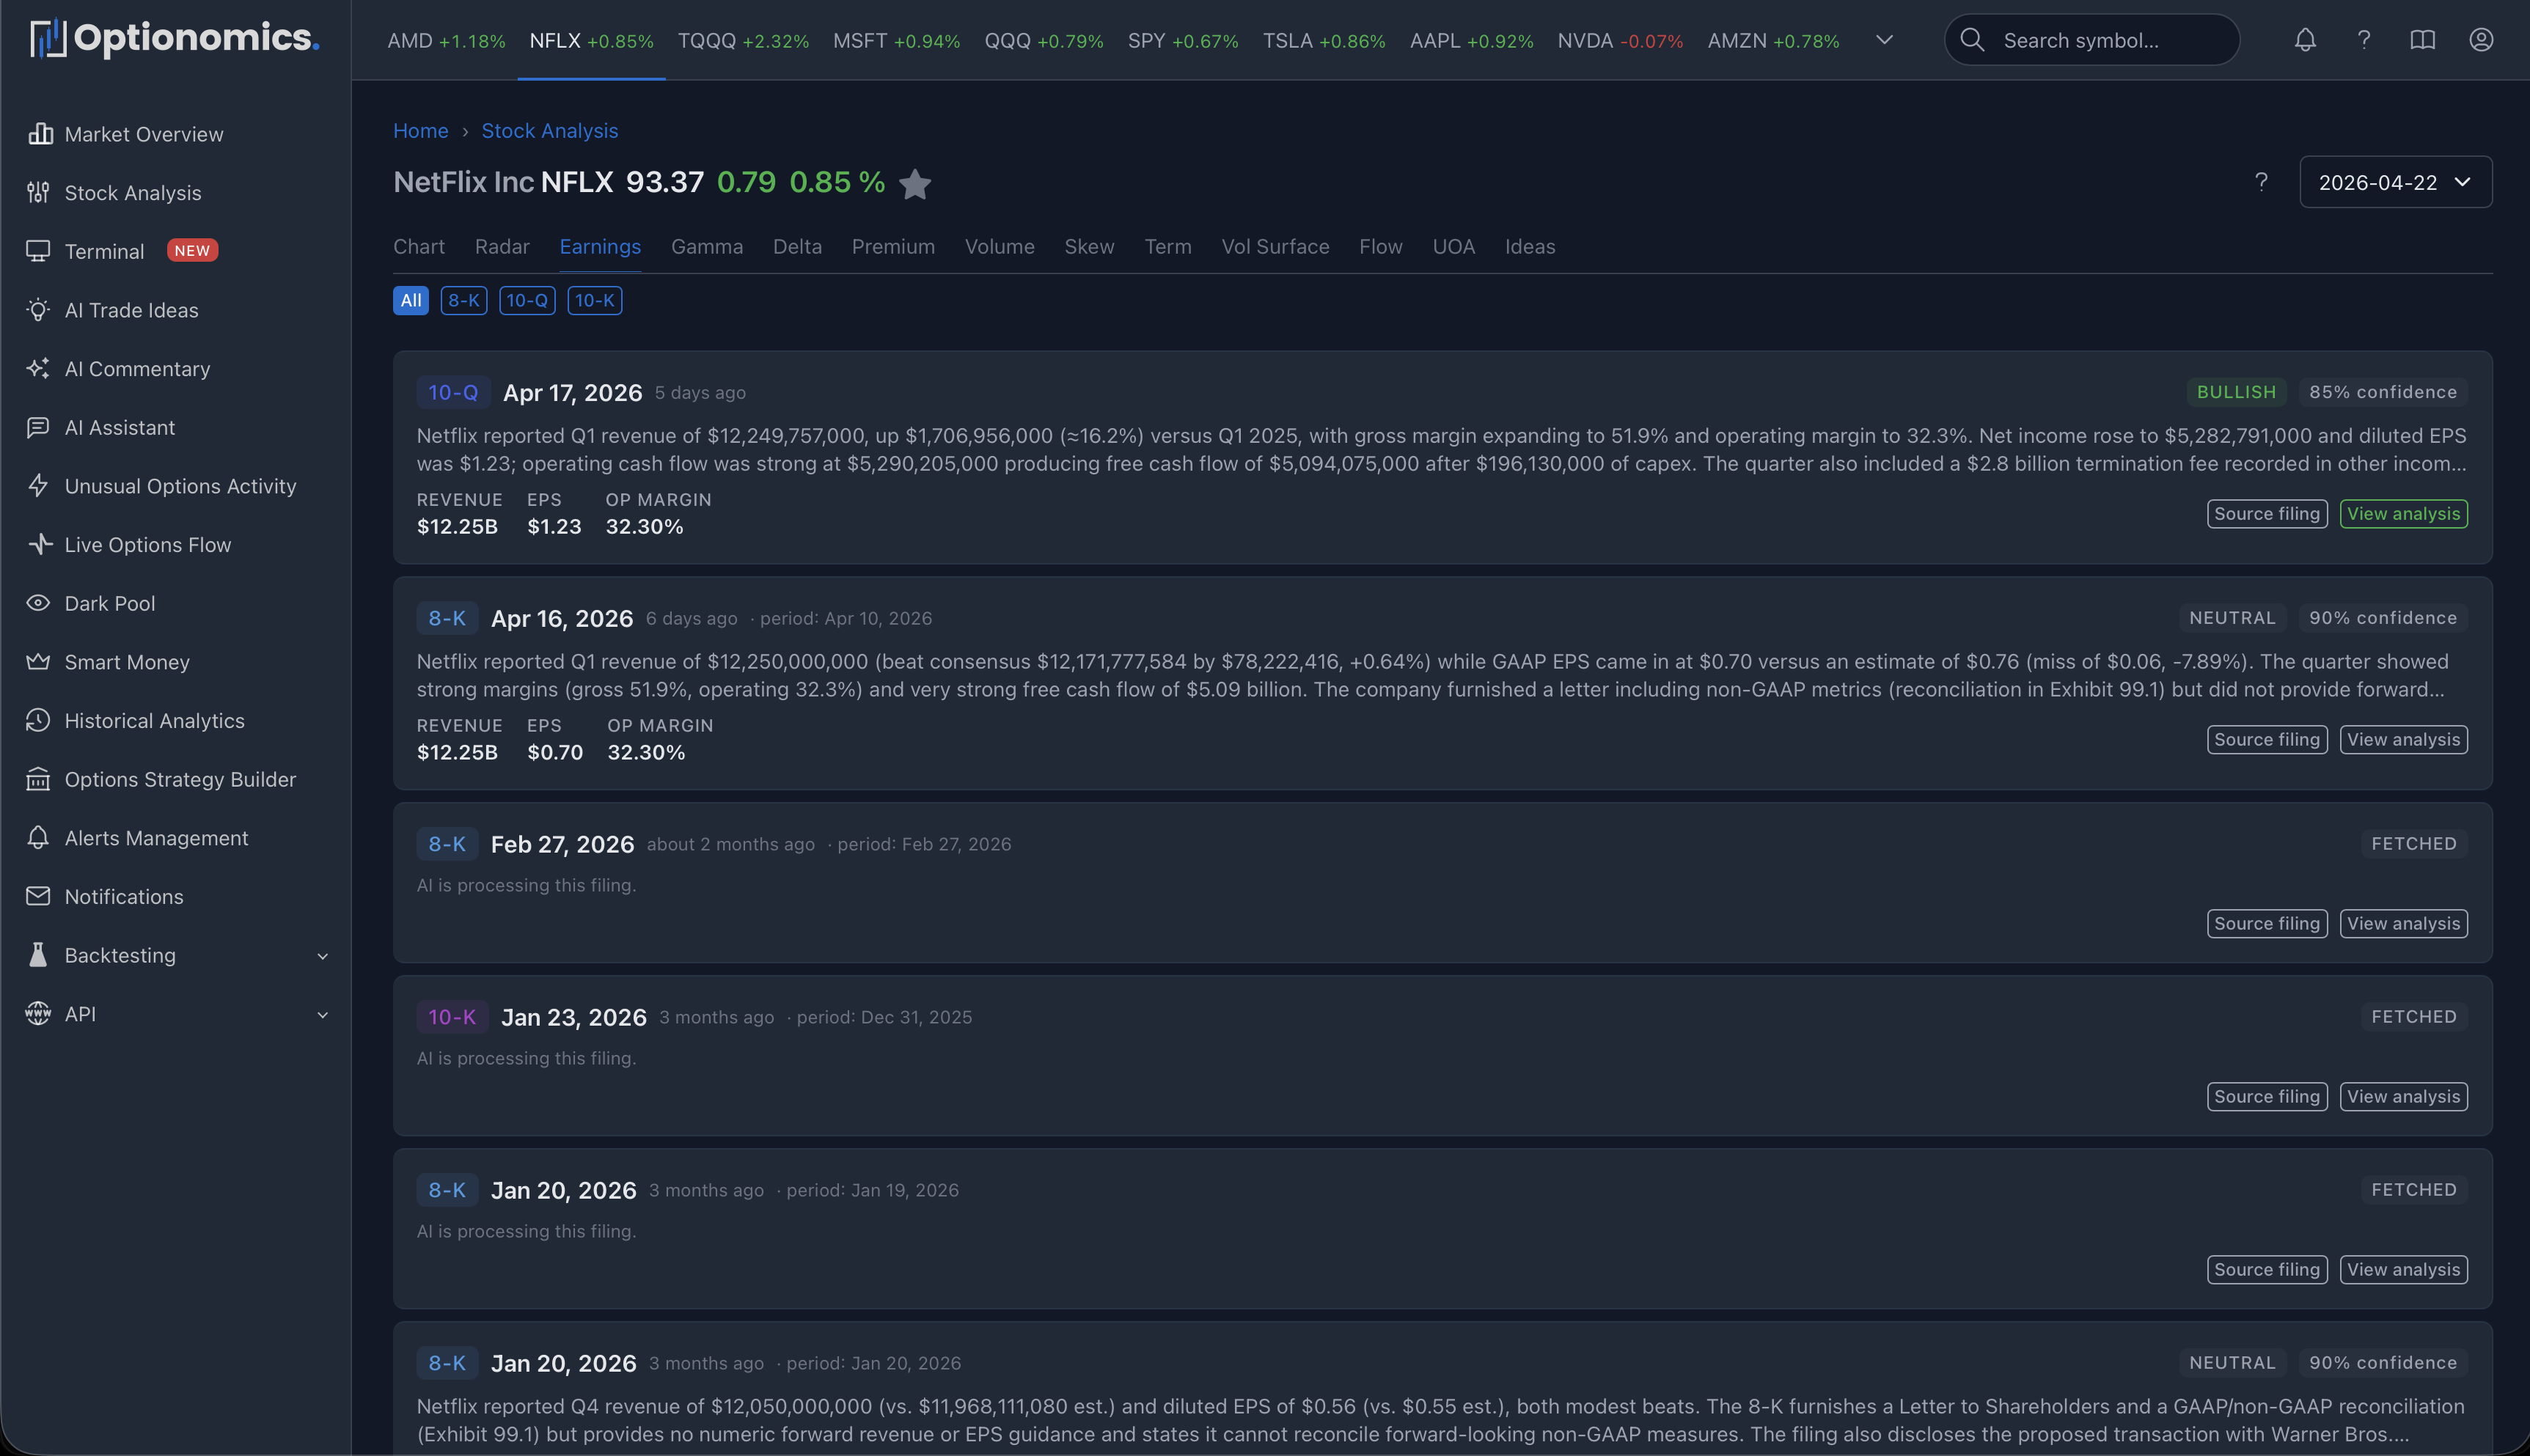
Filing list
The list view shows every filing the platform has indexed for the symbol, filterable by form type (e.g. 10-K, 10-Q, 8-K). Each card shows the form, the date filed, the analysis sentiment when available, and a one-paragraph summary—plus a link into the full analysis.
If a filing is still being analyzed, you’ll see “Analysis pending” with a refresh hint. If analysis is unavailable, try again later or contact support.
Single-filing analysis
The detail view for a filing is built around three blocks:
Executive summary
A short, written-out summary of the filing—what changed, what management emphasized, and what the platform thinks the most important takeaway is. The header carries:
| Element | Meaning |
|---|---|
| Form badge | 10-K, 10-Q, 8-K, etc. |
| Filed date | When the filing was made publicly available |
| Sentiment badge | Overall tone (bullish / neutral / bearish) |
| Confidence badge | Model confidence in the analysis (when available) |
| Source filing | Link to the original public document |
Highlights & Risks
A two-column layout: positive items on the left, risk items on the right. Each item has a short title and a longer explanation. This is the fastest way to get a feel for what improved and what got worse—often the same paragraph that takes 20 minutes to find inside the actual filing.
Reported metrics, guidance, and history
On the right side of the page you get a structured panel:
- Reported Metrics — Revenue, EPS, Gross Margin, Operating Margin, Free Cash Flow for the selected quarter, with a surprise % vs estimates where applicable.
- Guidance — Forward revenue and EPS ranges when the filing or recent press releases provide them. If guidance was not in this filing but appeared in a recent one, the panel borrows that guidance and flags it (with a link to the source).
- Last 4 Quarters — A compact table of Revenue, EPS, Gross %, Op %, and FCF across the last four reported quarters.
- Risk Changes vs Prior Filing — When the analysis can compare to the prior filing of the same form type, new risks and resolved risks are listed.
Financial Story (charts)
Below the analysis, a financial story section visualizes the company across multiple lenses. Not every chart applies to every filing, but the typical set includes:
| Section | Charts |
|---|---|
| This Quarter | Income Statement Flow (Sankey), Cash Flow Bridge, Segment Mix |
| Track Record | YoY Growth, EPS Surprise Track Record, Revenue & EPS Trend, Margin Trend, Margin Composition, Earnings vs Cash, CapEx Intensity, R&D Intensity, Effective Tax Rate, Sequential Growth Heatmap |
| Sentiment | Sentiment Timeline across recent filings |
A quarter selector at the top of the section lets you walk through prior quarters without leaving the page so you can compare “how did this quarter look compared to a year ago?” in one click.
Important context
- Earnings analyses are AI-assisted summaries of public filings, not investment advice or audited research.
- The sentiment and confidence scores are model outputs—use them as orientation, not as a verdict.
- When guidance is borrowed from a previous filing, the panel makes that explicit; treat the carried-over numbers with appropriate skepticism.
- Surprise percentages depend on consensus estimates being available for that period—when they are not, the surprise field is omitted.
- Always cross-check the source filing for anything that will drive a real decision.
Remember: Use the Earnings tab to scan a quarter in minutes and decide whether to read the actual filing in detail. The summary and charts are starting points, not a replacement for primary documents.
Related: