ML Anomaly Detection
Machine-learning-scored unusual options trades
What this page is
ML Anomaly Detection is the filterable list view of options prints that the platform has scored as statistically unusual using machine learning—not just rule-based criteria. The same scoring also appears as the ML column on Unusual Options Activity and as the AI Anomaly Trades sidebar card; this page exists for traders who prefer to work the list directly, sort by score, and drill down by symbol, return, or premium.
Where Unusual Options Activity is built around alert types (whale, sweep, aggressive call buying, etc.), this page is built around the anomaly score itself: each row asks, “how rare does this print look compared with what we’d expect for this contract?”
Availability: Theta and Vega plans
Open it in the app: Anomalies (also surfaced as the AI Anomaly Trades sidebar card on Unusual Activity).
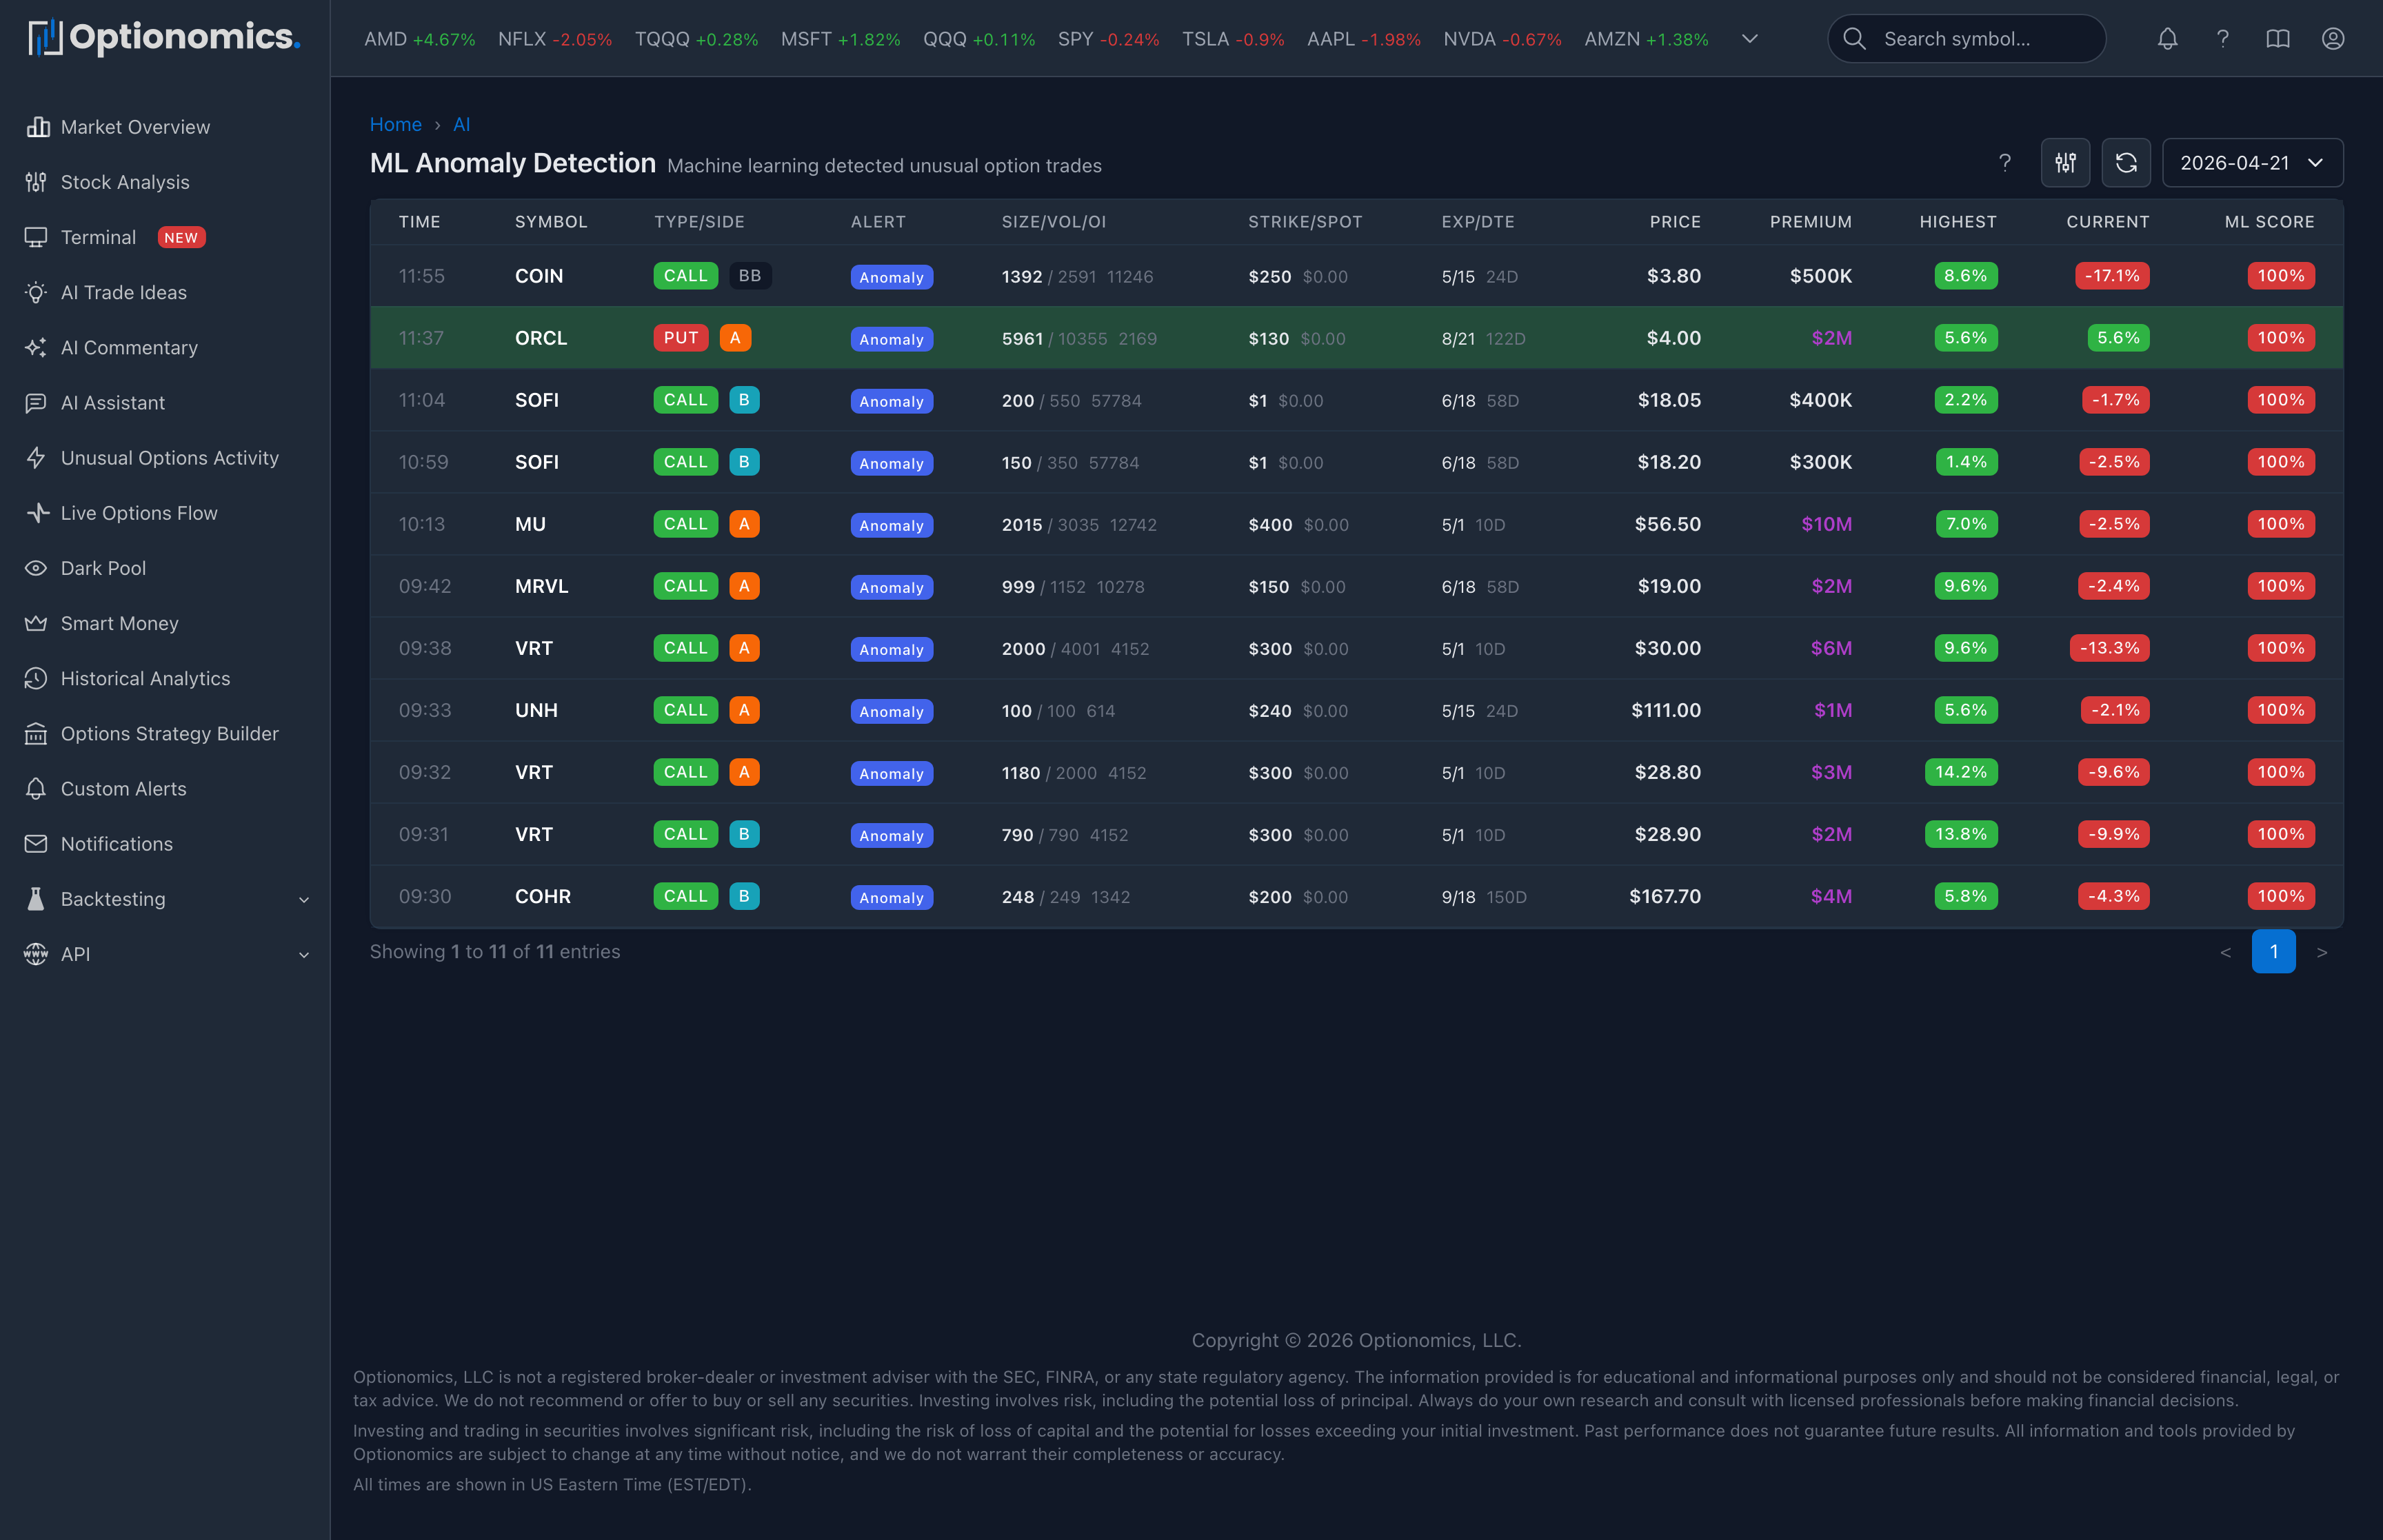
What each row shows
| Column | Meaning |
|---|---|
| Time | When the trade printed |
| Symbol | Underlying ticker |
| Type / Side | Call or put, and execution side (above/at ask, mid, at/below bid) |
| Alert | The unusual-activity classification, when one applies |
| Size / Vol / OI | Contracts traded, day’s volume, and current open interest for context |
| Strike / Spot | Option strike and the underlying price near the print |
| Exp / DTE | Expiration date and days to expiration |
| Price | Per-contract premium paid |
| Premium | Total notional paid on the print |
| Highest | Best favorable return reached since the print (peak excursion) |
| Current | Live return vs the print price |
| ML Score | Anomaly confidence from the model (higher = more unusual) |
Sorting on ML Score, Premium, Highest, or Current lets you ask very different questions—for example, “show me the highest-confidence anomalies today, regardless of size,” or “show me the largest anomalies that have already moved.”
Filters
Use the filter sheet to narrow the list. Common filters include:
- Symbol — single ticker or list
- Date — pick any prior trading day
- ML score — minimum confidence threshold
- Premium / Size — focus on bigger commitments
- Option type / side — calls only, puts only, aggressive buys, etc.
Combine sort + filter to build the view you want—then click into a row to see the full options contract page for chart, IV, OI, and historical context.
How it relates to other unusual-activity surfaces
| If you want… | Use |
|---|---|
| The full live tape of every print | Live Options Flow |
| Curated alerts grouped by alert type with sidebars | Unusual Options Activity |
| A score-first, filterable list with peak/current return per row | This page (Anomalies) |
| To get notified when matching anomalies appear | Alerts Management |
Important context
- ML score measures statistical rarity for the contract and conditions, not probability of profit.
- The same trade can be a hedge, opening leg of a spread, closing trade, or outright bet—the tape rarely proves which.
- Highest and Current are informational snapshots—they are not your fill, your slippage, or your risk plan.
- Returns are computed on the option contract and can be highly sensitive to time decay, IV moves, and underlying jumps.
Remember: This page helps you spend your attention on the prints that look statistically unusual. Validate each idea with the rest of the platform—chain context, news, and your own rules—before acting.
Related: