Dark Pool Trades
Off-exchange equity prints distilled into a daily dashboard
Why dark pool data belongs in an options platform
Options traders care about where stock is likely to trade and hold: large lit prints move spot immediately, but much institutional equity volume still prints in off-exchange venues. Those prints can leave price memory—levels where size changed hands without showing up in the same way on the public tape. Optionomics surfaces dark pool activity so you can overlay that equity context with gamma, walls, and flow you already use on the name.
Dark pool trades are typically large equity blocks executed with minimal pre-trade visibility, often by institutions managing impact and information leakage. They are not a holy grail: a print can be accumulation, distribution, internal crossing, or one leg of a broader program. Treat them as additional context, especially when they cluster at a price zone or align with options-derived support or resistance.
Availability: Gamma plan and higher
Pairs well with: Terminal Dark Pool S/R overlays and gamma exposure for confluence checks.
Open it: Sidebar → Dark Pool (also at /darkpool).
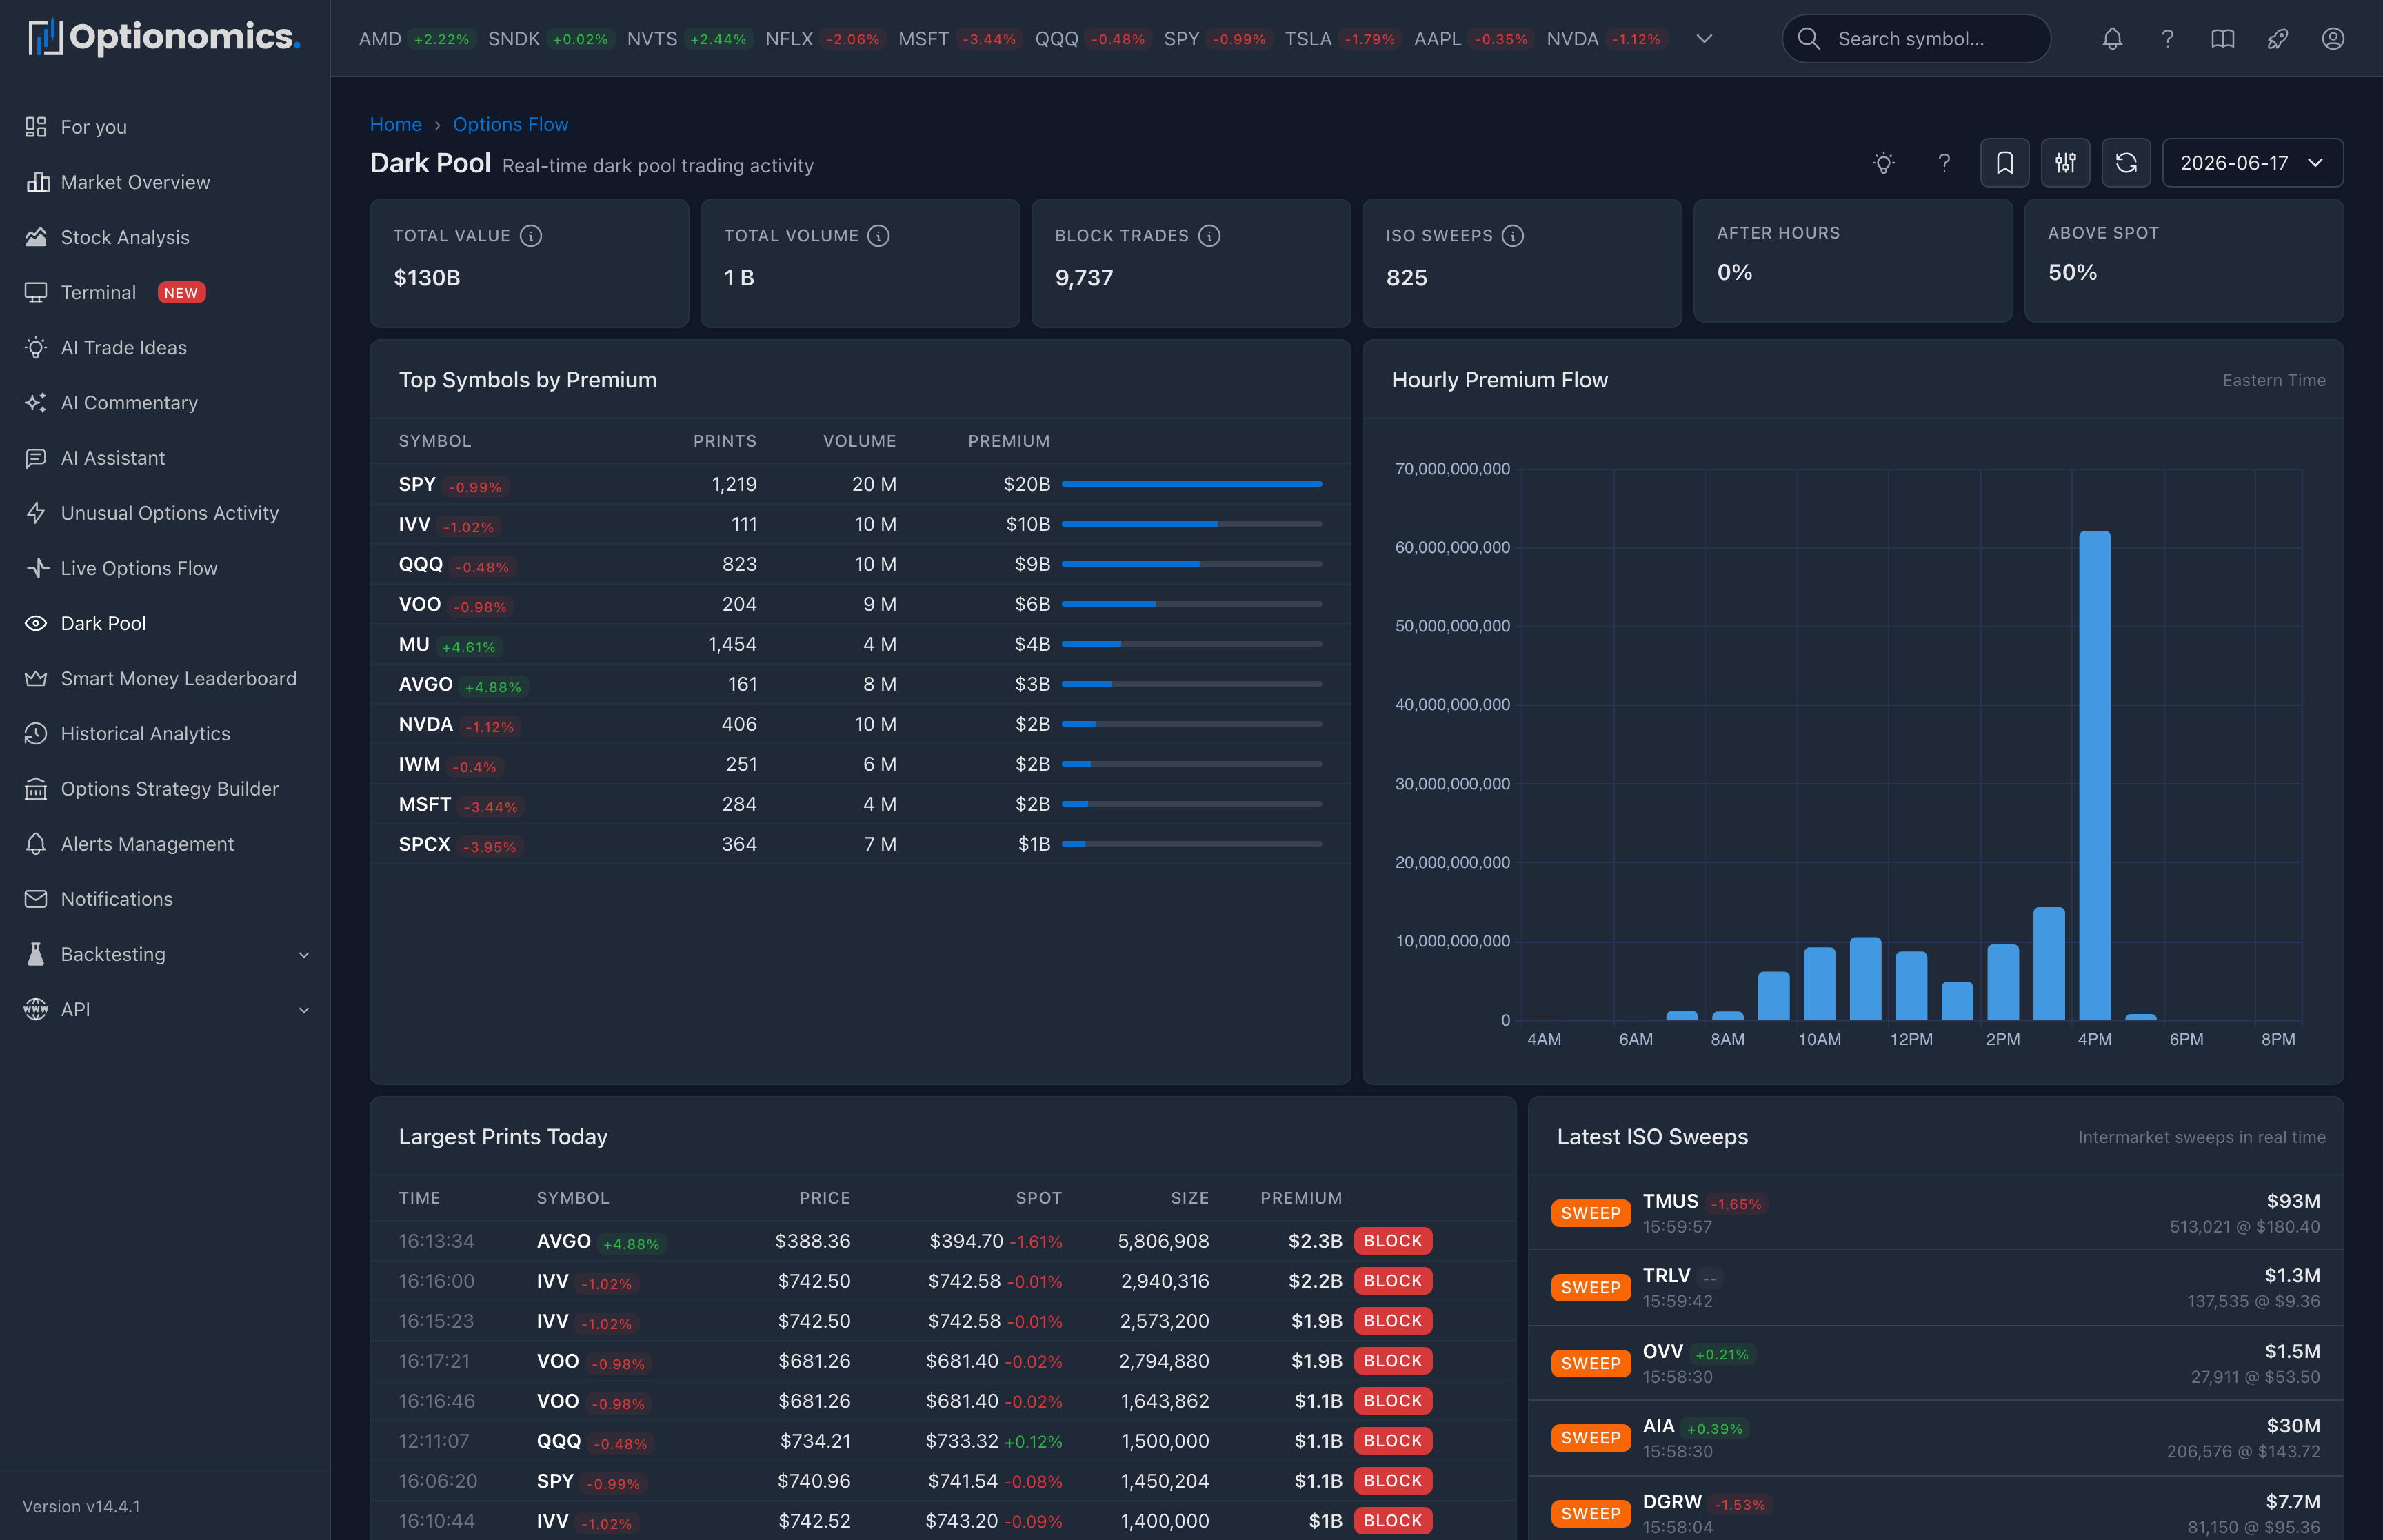
Dashboard view (no symbol selected)
When you open the page without a specific symbol, you get a widget dashboard for the entire day:
Top stat tiles
| Tile | What it shows |
|---|---|
| Total Value | Aggregate dollar volume across all dark pool prints |
| Total Volume | Aggregate share volume |
| Block Trades | Count of trades flagged as blocks |
| ISO Sweeps | Count of intermarket sweep orders |
| After Hours | Share of prints that occurred outside regular session |
| Above Spot | Share of prints that occurred above the underlying’s spot price |
Widgets
| Widget | What it shows |
|---|---|
| Top Symbols | Symbols with the highest dark pool dollar value today |
| Hourly Premium Flow | How dark pool dollars distribute across the trading day, hour by hour |
| Largest Prints Today | The biggest individual prints across the market |
| Recent Sweeps | The latest sweep prints rolling in |
| Spot Sentiment | Share of prints above vs below underlying spot, as a sentiment read |
The dashboard updates throughout the trading day as new prints arrive and lets you spot where institutional dollars are concentrating without opening every name.
Symbol-focused view
Click any symbol from a widget (or use the filter to focus on one) and the page rebuilds around that ticker:
- The header switches to “{symbol} dark pool dashboard.”
- A single-symbol breakdown replaces the market-wide widgets, showing that symbol’s prints, hourly distribution, and spot-relative behavior.
- Use All Symbols in the header to drop back to the full dashboard.
Use this view when a name shows up in Smart Money Conviction, in your watchlist, or in flow you’re already tracking, and you want to see the equity-side behavior alongside the options story.
Filtering and Time Travel
The header gives you:
- Filter — narrow by size, value, trade type, or other dark pool attributes.
- Date — Time Travel to any prior trading day.
- Refresh — manual refresh on top of automatic updates.
Filters and the chosen date persist while you switch between the market-wide dashboard and a single symbol.
How to read dark pool prints
Trade type tags
| Tag | Meaning | Significance |
|---|---|---|
| BLOCK | Block trade (negotiated) | Large institutional order |
| ISO | Intermarket sweep order | Urgent, time-sensitive execution |
| AFTER HRS | Extended-hours print | Outside regular session |
| ODD LOT | Non-standard lot size | Unusual execution detail |
Patterns to look for
| Pattern | What it may mean |
|---|---|
| Repeated prints clustered at the same price | Possible accumulation / distribution zone |
| Large prints near highs with weakening price | Possible distribution |
| Large prints near lows with stabilizing price | Possible accumulation |
| Heavy after-hours value | Window to absorb size away from the lit tape |
| Sweeps clustering on a single name | Urgency from a single side |
| Print far from spot with very large value | Often a special situation (M&A, portfolio trade, basket leg) |
Building support / resistance from dark pool
A single print rarely defines a level. What strengthens a level:
| Factor | Weak level | Strong level |
|---|---|---|
| Trade size | Small | Very large value |
| Repetition | Single print | Multiple prints at the same price |
| Recency | Many days old | Within the last day or two |
| Deviation from spot | Far from spot | Close to spot |
The strongest dark pool levels usually co-locate with options-derived levels you already see in gamma exposure or in the chart’s DP overlay—use that confluence rather than dark pool alone.
Important context
- Dark pool prints are anonymous; the side (buy vs sell) is inferred, not certified.
- Large prints can be opening, closing, or one leg of a complex strategy—the tape rarely proves which.
- After-hours and odd-lot prints often look unusual; that does not always mean directional.
- Treat dark pool levels as additional evidence, not a primary trigger.
Remember: Dark pool data shows where institutional equity volume printed, not where price must go. Use it for confluence with options positioning, news, and your own plan.
Related:
- Options Flow
- Terminal — dark pool S/R overlays on the chart
- Terminal — DP toggle on the symbol chart
- Gamma Exposure
- Smart Money Conviction