Market Overview
The whole market at a glance
The Market Overview is designed as a first stop before you drill into single names. Instead of loading ten tickers to ask “is risk-on or risk-off showing up in options?”, you get a single canvas: broad sentiment, flow-weighted hints, unusual prints surfaced at the market level, and lists that highlight where activity clusters. From here you typically jump to options flow, a stock page, or daily analytics once you know which stories matter today.
Availability: All plans (Delta and higher)
AI Market Insight
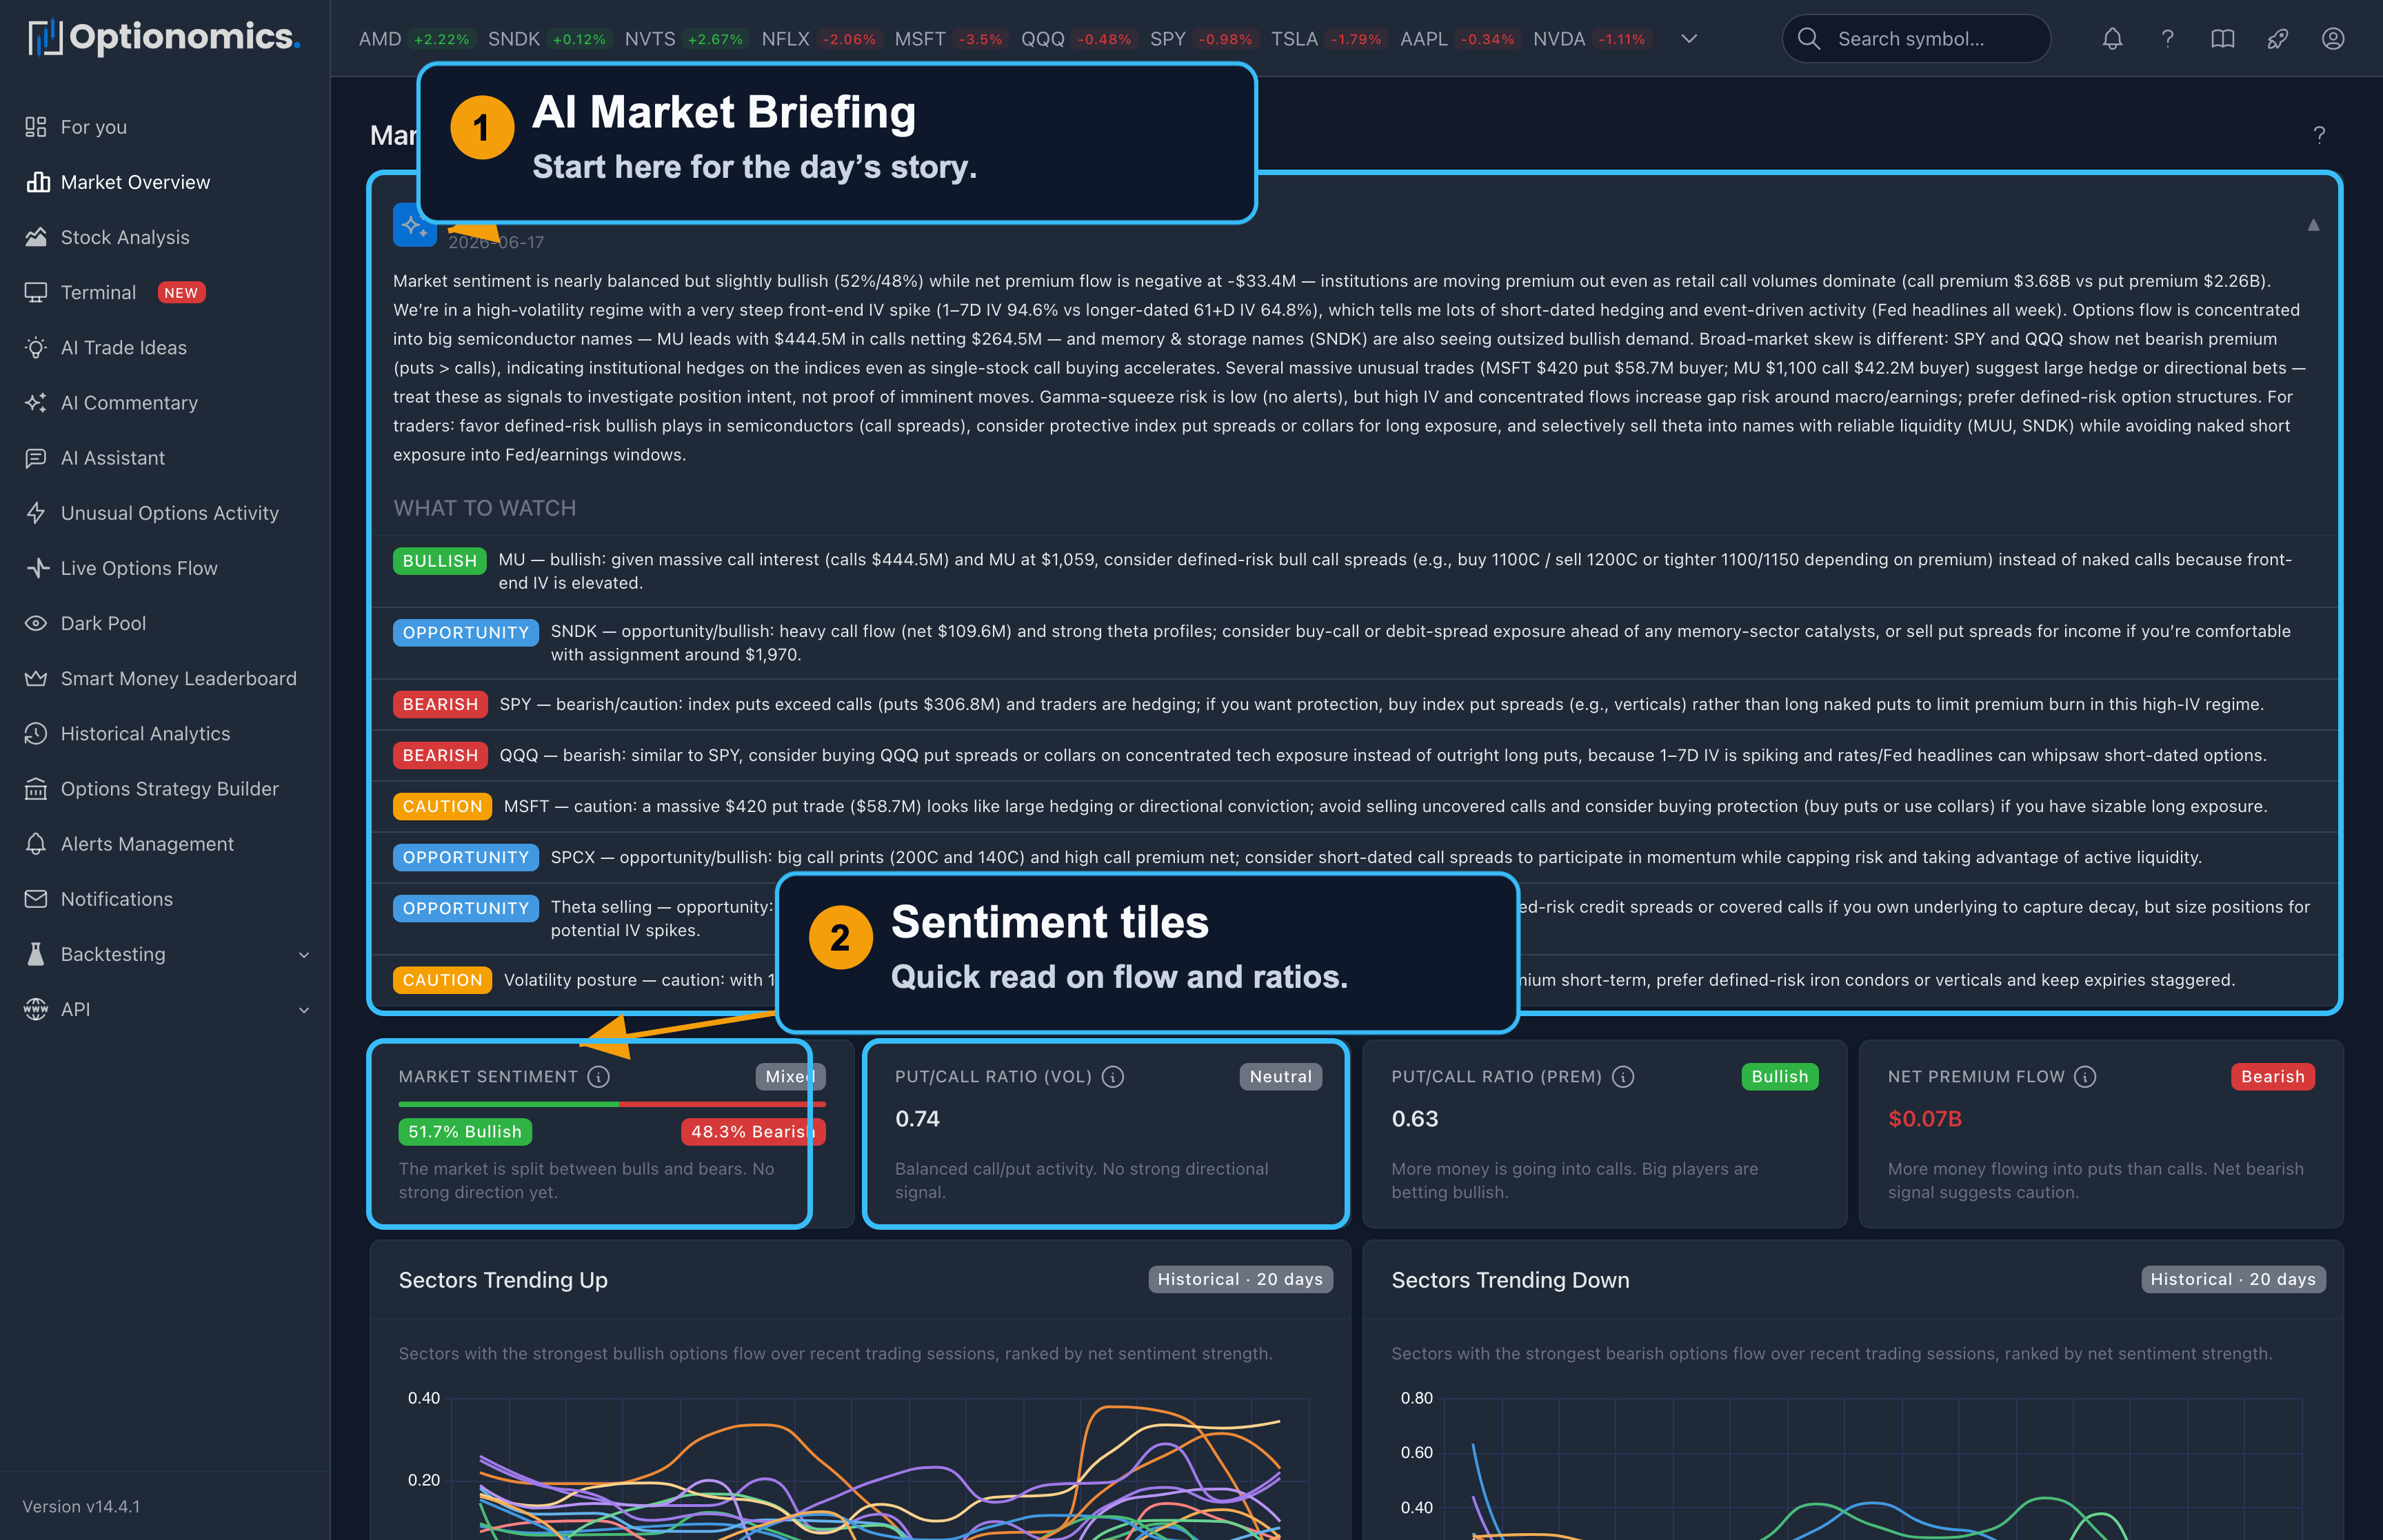
The page opens with an AI-written market briefing: a short narrative of what the tape is doing today—sentiment, where premium is concentrating, what stands out—plus suggested action items so you know where to click next. Treat it as orientation, not a recommendation; every claim can be cross-checked in the sections below it.
Key Indicators (Top Section)
The top band is a live summary of how the aggregate options complex is behaving. Numbers refresh frequently so you can glance between tasks and still notice regime changes—when puts start dominating premium, when term structure inverts, or when net call flow accelerates. Use the table below as a phrasebook for reading that strip:
| Indicator | What It Shows | Interpretation |
|---|---|---|
| Term Structure | IV across expirations | Contango (normal) vs Backwardation (event risk) |
| Market Sentiment | Bullish vs bearish % | >60% = Bullish market, <40% = Bearish market |
| P/C Volume Ratio | Put/call by contracts | >1.0 = More puts traded (bearish) |
| P/C Premium Ratio | Put/call by dollars | >1.0 = More $ in puts (bearish) |
| Net Premium Flow | Net $ into calls vs puts | Positive = Net bullish flow |
Unusual Activity
This section lifts exceptional prints out of the firehose: not every trade matters equally, and Market Overview emphasizes patterns—size, aggression, structure—that often interest both discretionary and systematic readers. It complements the full Unusual Activity page, where you can filter and inspect contracts in depth.
Automatically detected unusual trades include:
- Whale trades: $500K+ premium or 1000+ contracts
- Aggressive buying: At/above ask with urgency
- Block trades: Large negotiated trades >$100K
- Sweep orders: Multi-exchange sweeps
- Volume spikes: Trade size ≥10% of open interest
- IV spikes: Unusual volatility increases
- Far OTM positioning: Unusual strike selection
Options Flow by Stock
A spatial summary of flow: many symbols at once, colored by net call vs put tone so you spot pockets of bullish or bearish premium without opening each chain. It is intentionally high level—use it to prioritize which names deserve a full flow pass.
- Green: call (bullish) bets dominate
- Red: put (bearish) bets dominate
Top Movers
Most Bullish
Criteria: Stocks with highest call premium and positive net flow
Most Bearish
Criteria: Stocks with highest put premium and negative net flow
Volume Leaders
Criteria: Most actively traded by options volume
Displays:
- Symbol and current price
- Total options volume (contracts)
- Total premium for the day
Volatility Analysis
High IV Stocks
Stocks with elevated implied volatility often precede earnings, FDA decisions, or other catalysts.
| IV Rank | Meaning | Color |
|---|---|---|
| 80-100% | Extremely high—near historical max | Red |
| 60-80% | Elevated—above average | Yellow |
| 40-60% | Normal range | Green |
| 20-40% | Below average—cheap options | Blue |
| 0-20% | Extremely low—near historical min | Purple |
IV Trends
How implied volatility has trended at the market level, alongside the current reading.
Sector Rotation
Two complementary views of sector behavior:
- Sectors Trending Up / Trending Down — which sectors gained or lost flow over the last ~20 trading days.
- Hot & Cold Sectors — intraday sector activity, so you can see today’s rotation as it happens.
Theta Decay
Income-oriented context for premium sellers—where time decay is rich today.
Volatility Skew
Skew-based opportunity callouts, with a link into the per-symbol skew chart.
Many sections also carry a small AI insight strip—a one-line model commentary on what that section’s data is showing right now.
How to Use Market Overview
Typical workflow
- Glance at sentiment, net flow, and term-structure cues—are we in a calm carry day or a defensive tape?
- Scan unusual highlights and heatmap extremes for catalyst or positioning stories.
- Pick a small set of symbols from top movers or sector tiles, then open each in flow or analytics for the actual trade structure.
Navigation
Access: Choose Market Overview from the sidebar, or open /overview on the web app.
Related Features:
- Unusual Activity - Detailed unusual trade analysis
- Options Flow - Live trade stream
- Watchlist - Track your favorite stocks
- Daily Analytics - Deep dive into positioning
Remember: Market Overview provides market intelligence, not trading signals. Detection algorithms are statistical models. Not all signals are actionable. Always do your own research.