Expected Move Analysis
IV-predicted price movement
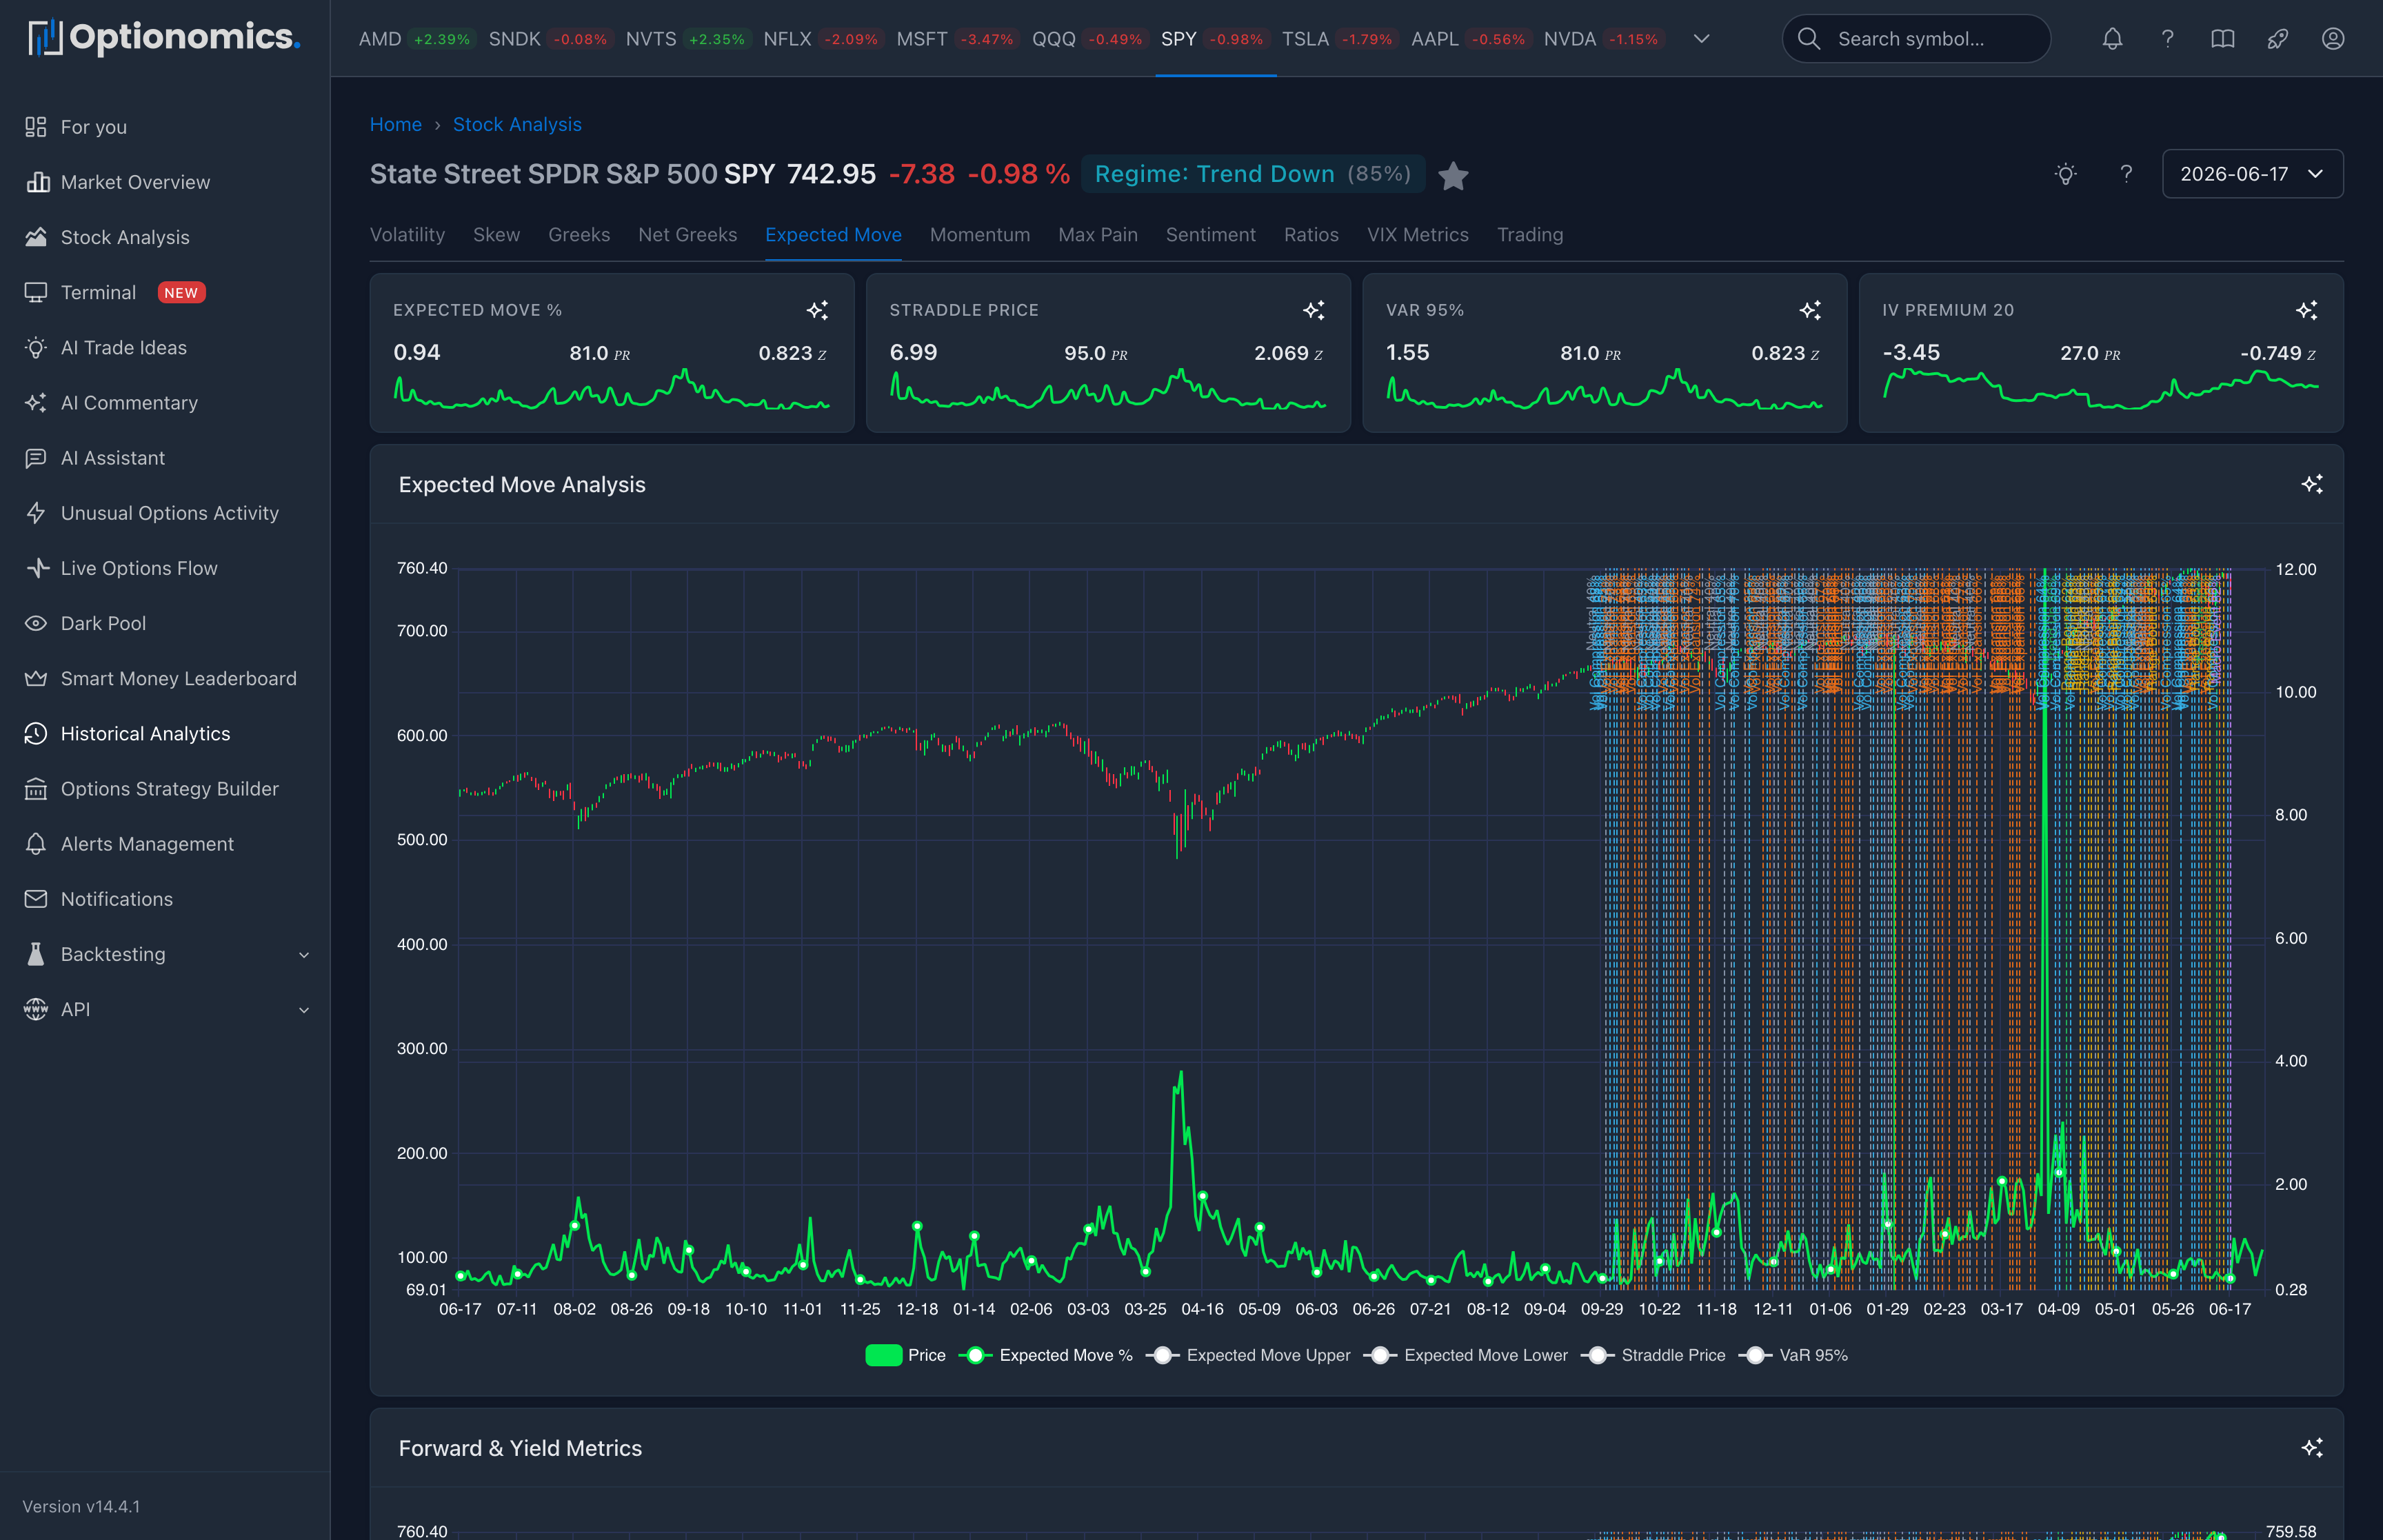
Track the market’s expected move and compare with actual price movement.
Sparkline Widgets
| Metric | Description |
|---|---|
| Expected Move % | Predicted 1-standard-deviation move |
| Straddle Price | ATM straddle cost (another way to view expected move) |
| VaR 95 20d | 95% Value at Risk over 20 days |
| IV Premium 20 | IV premium over 20-day realized volatility |
Charts
Expected Move Analysis
- Expected Move % (percentage)
- Expected Move Upper and Lower bounds
- Straddle Price, VaR 95 20d
Forward & Yield Metrics
- Implied Forward (market’s expected future price)
- Div/Borrow Yield
- Box Spread Yield and Credit
How Expected Move Works
Expected Move represents the market’s 1-standard-deviation prediction (~68% probability range) based on implied volatility and time to expiration.
Interpreting the Data
| Observation | Meaning |
|---|---|
| Wide expected move | High IV—market expects large price movement |
| Narrow expected move | Low IV—market expects small price movement |
| Price outside expected range | IV underestimated actual volatility |
| Price within expected range | IV correctly estimated volatility |
Questions to ask
| Scenario | Beginner-friendly question |
|---|---|
| Expected move is wide | What event or uncertainty is the options market pricing? |
| Expected move is narrow | Is the market complacent, or has the stock also been quiet? |
| Moves often stay inside the range | Is implied volatility usually richer than realized movement for this symbol? |
| Moves often break the range | Are there catalysts or regimes where options repeatedly underpriced risk? |
Note: Expected move is probabilistic. Past accuracy doesn’t guarantee future results.
