Volatility Metrics
Historical implied and realized volatility
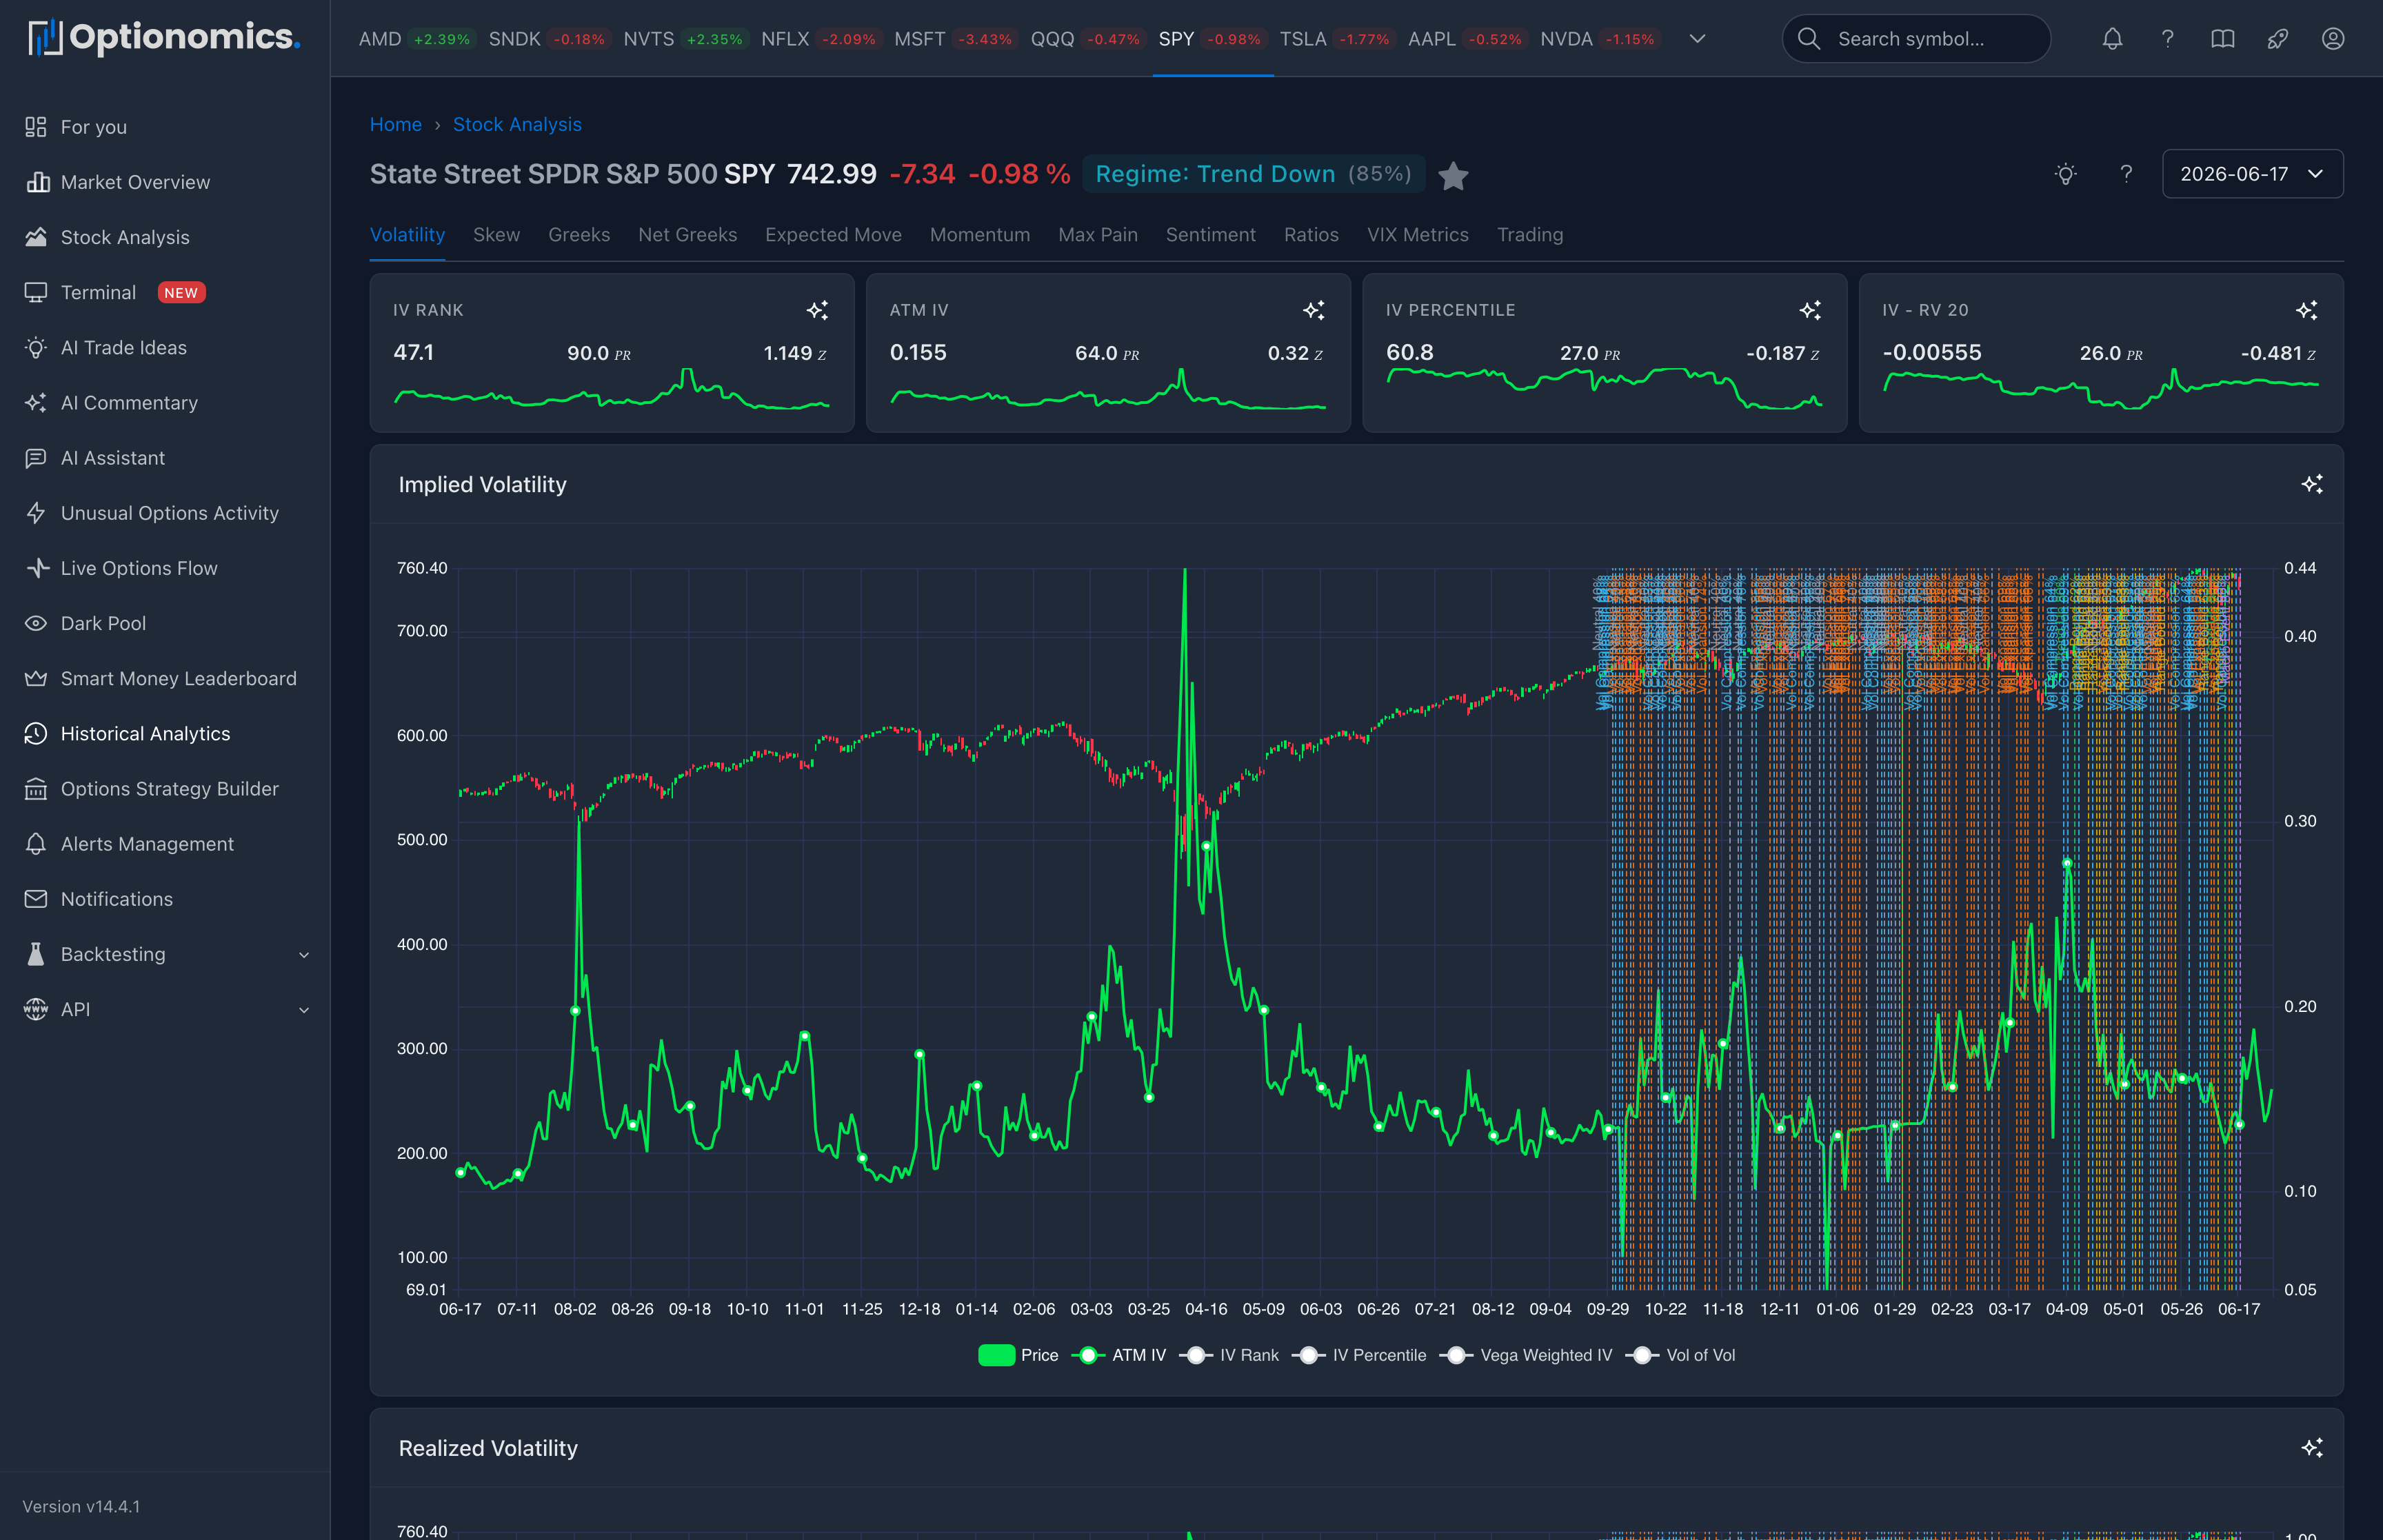
Track implied and realized volatility patterns over time so you can see whether today’s option prices look high, low, or normal for the symbol.
Sparkline Widgets
| Metric | Description |
|---|---|
| IV Rank | Current IV vs 52-week range (0-100%) |
| RV 30 | 30-day realized (historical) volatility |
| IV Percentile | % of time IV has been lower historically |
| IV - RV 20 | Difference between implied and 20-day realized volatility |
Charts
Implied Volatility
- ATM IV, IV Rank, IV Percentile
- Vega Weighted IV, Vol of Vol
Realized Volatility
- RV 5, RV 10, RV 20, RV 30, RV 60 (different lookback periods)
Comparative Volatility
- IV Minus RV20, IV Premium 20
- IV Rank, IV Percentile
Structural Volatility
- IV Skew Z Score, Vol Term Structure Slope
- IV Mean Reversion Z, Tail Risk Indicator
Interpreting the Data
| Metric | Low Value | High Value |
|---|---|---|
| IV Rank | Cheap options (0-20%) | Expensive options (80-100%) |
| IV - RV | IV discount (negative) | IV premium (positive) |
| IV Percentile | Low relative IV | High relative IV |
Questions to ask
| Observation | Beginner-friendly question |
|---|---|
| High IV Rank | Is the market pricing unusually large moves, and is there a known event explaining it? |
| Low IV Rank | Is the market unusually calm, or is realized volatility also quiet? |
| IV > RV | Are options pricing more movement than the stock has recently delivered? |
| IV < RV | Is recent realized movement unusually high compared with current option pricing? |
Note: Past volatility patterns may not repeat. Use with other analysis.
