Options Flow Chart
Price action meets options flow
The Options Flow Chart overlays options activity on price, showing you how flow correlates with price movement throughout the day.
Availability: Gamma plan and higher ($59/month+)
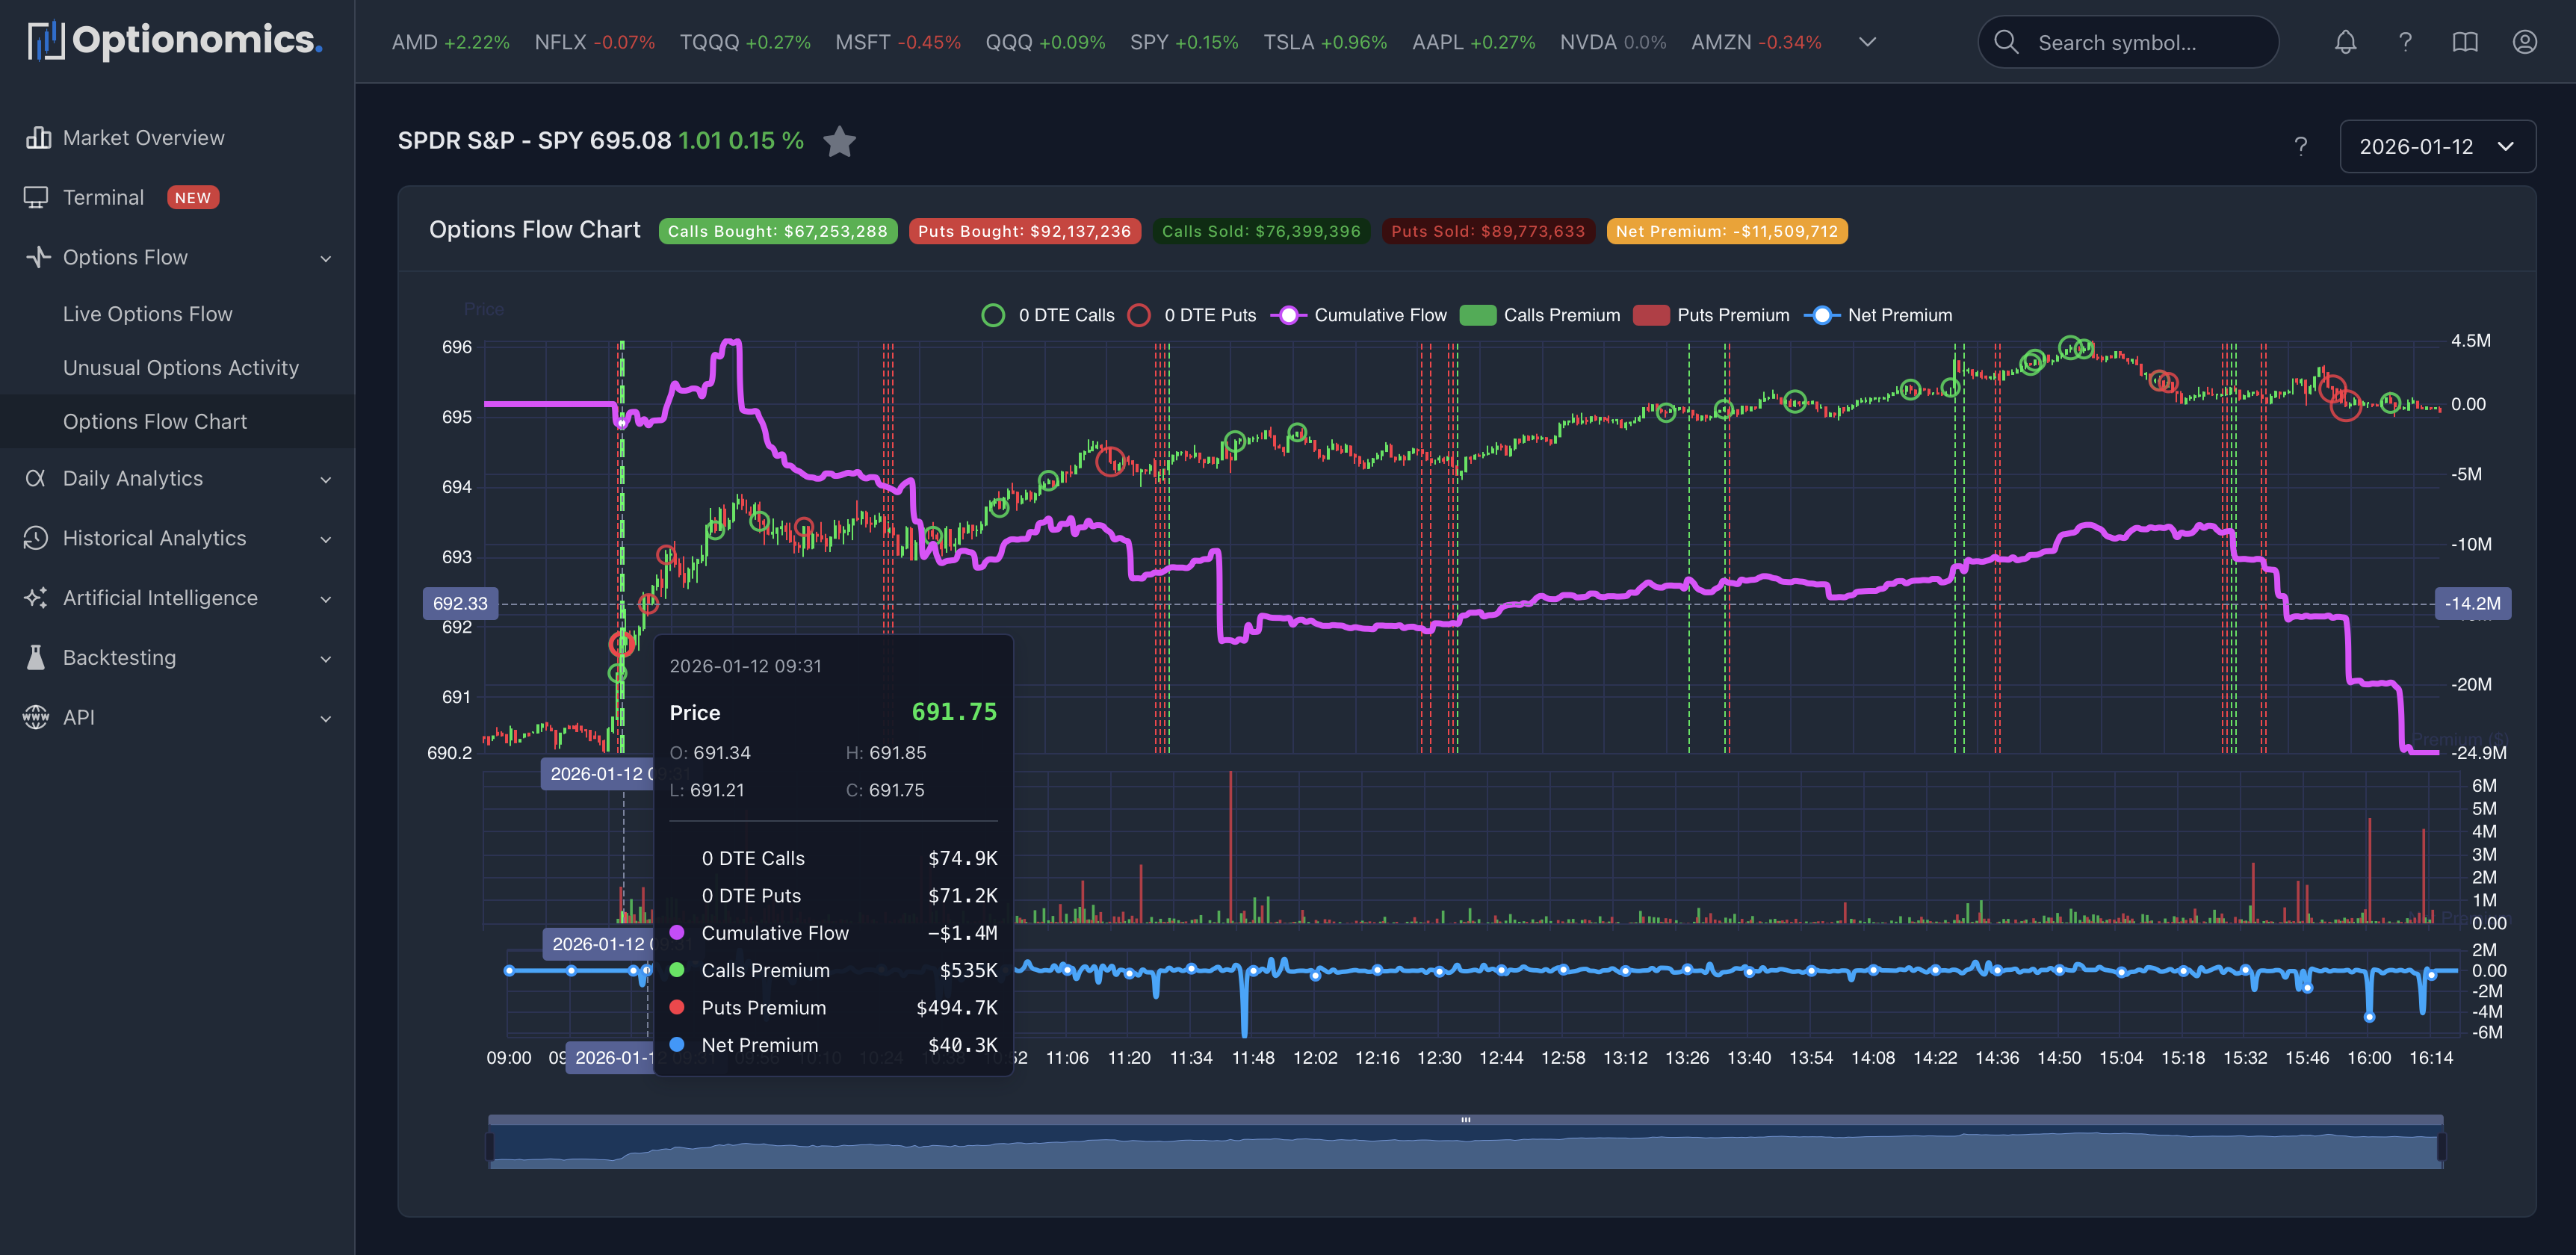
Chart Components
The chart combines multiple data layers for comprehensive analysis:
| Layer | What It Shows | Details |
|---|---|---|
| Candlesticks | Intraday price action | 1-minute, 5-minute, or custom intervals |
| Green Bars | Call premium (aggressive buys) | Calls bought at/above ask—bullish flow |
| Red Bars | Put premium (aggressive buys) | Puts bought at/above ask—bearish flow |
| Flow Line | Cumulative net premium | Running total of calls minus puts |
| Bubbles | 0DTE trades | Same-day expiration trades—gamma plays |
| Vertical Lines | Unusual activity alerts | ML-flagged significant trades |
Interactive Features:
- Hover over any bar to see detailed trade breakdown
- Zoom and pan to focus on specific time periods
Premium Summary (Header)
| Metric | Description |
|---|---|
| Calls Bought | Premium on call purchases at/above ask |
| Puts Bought | Premium on put purchases at/above ask |
| Calls Sold | Premium on call sales at/below bid |
| Puts Sold | Premium on put sales at/below bid |
| Net Premium | Calls minus puts |
Reading the Flow Line
The cumulative flow line shows net positioning throughout the day:
| Pattern | Interpretation |
|---|---|
| Rising line | Net call buying (bullish flow) |
| Falling line | Net put buying (bearish flow) |
| Sharp spike | Large trade or cluster |
| Flat line | Balanced or quiet period |
0DTE Bubbles
Same-day expiration trades appear as bubbles:
- Size = Premium spent
- Green = Calls
- Red = Puts
0DTE activity often signals event-driven bets or gamma plays.
Flow + Price Patterns
Understanding the relationship between flow and price movement:
| Pattern | What It May Suggest | Confidence Level |
|---|---|---|
| Call flow spike → price rise | Flow preceded the move—smart money positioned early | High |
| Price up + put flow rising | Hedging into strength—taking profits or protecting gains | Medium |
| Flow divergence from price | Potential reversal setup—flow not confirming price | Medium |
| Heavy flow at support/resistance | Conviction at key level—institutions defending/attacking | High |
| Price rises, flow flat | Weak move—lack of options conviction | Low |
| Massive flow, price unchanged | Hedging or spread activity—not directional | Low |
| Flow and price aligned | Strong trend—both confirming direction | Very High |
| 0DTE spike at level | Gamma positioning at strike—potential pin | Medium |
Remember: Flow shows correlation, not causation. Large trades can be hedges or wrong.