Unusual Options Activity
Trades that stand out from the crowd
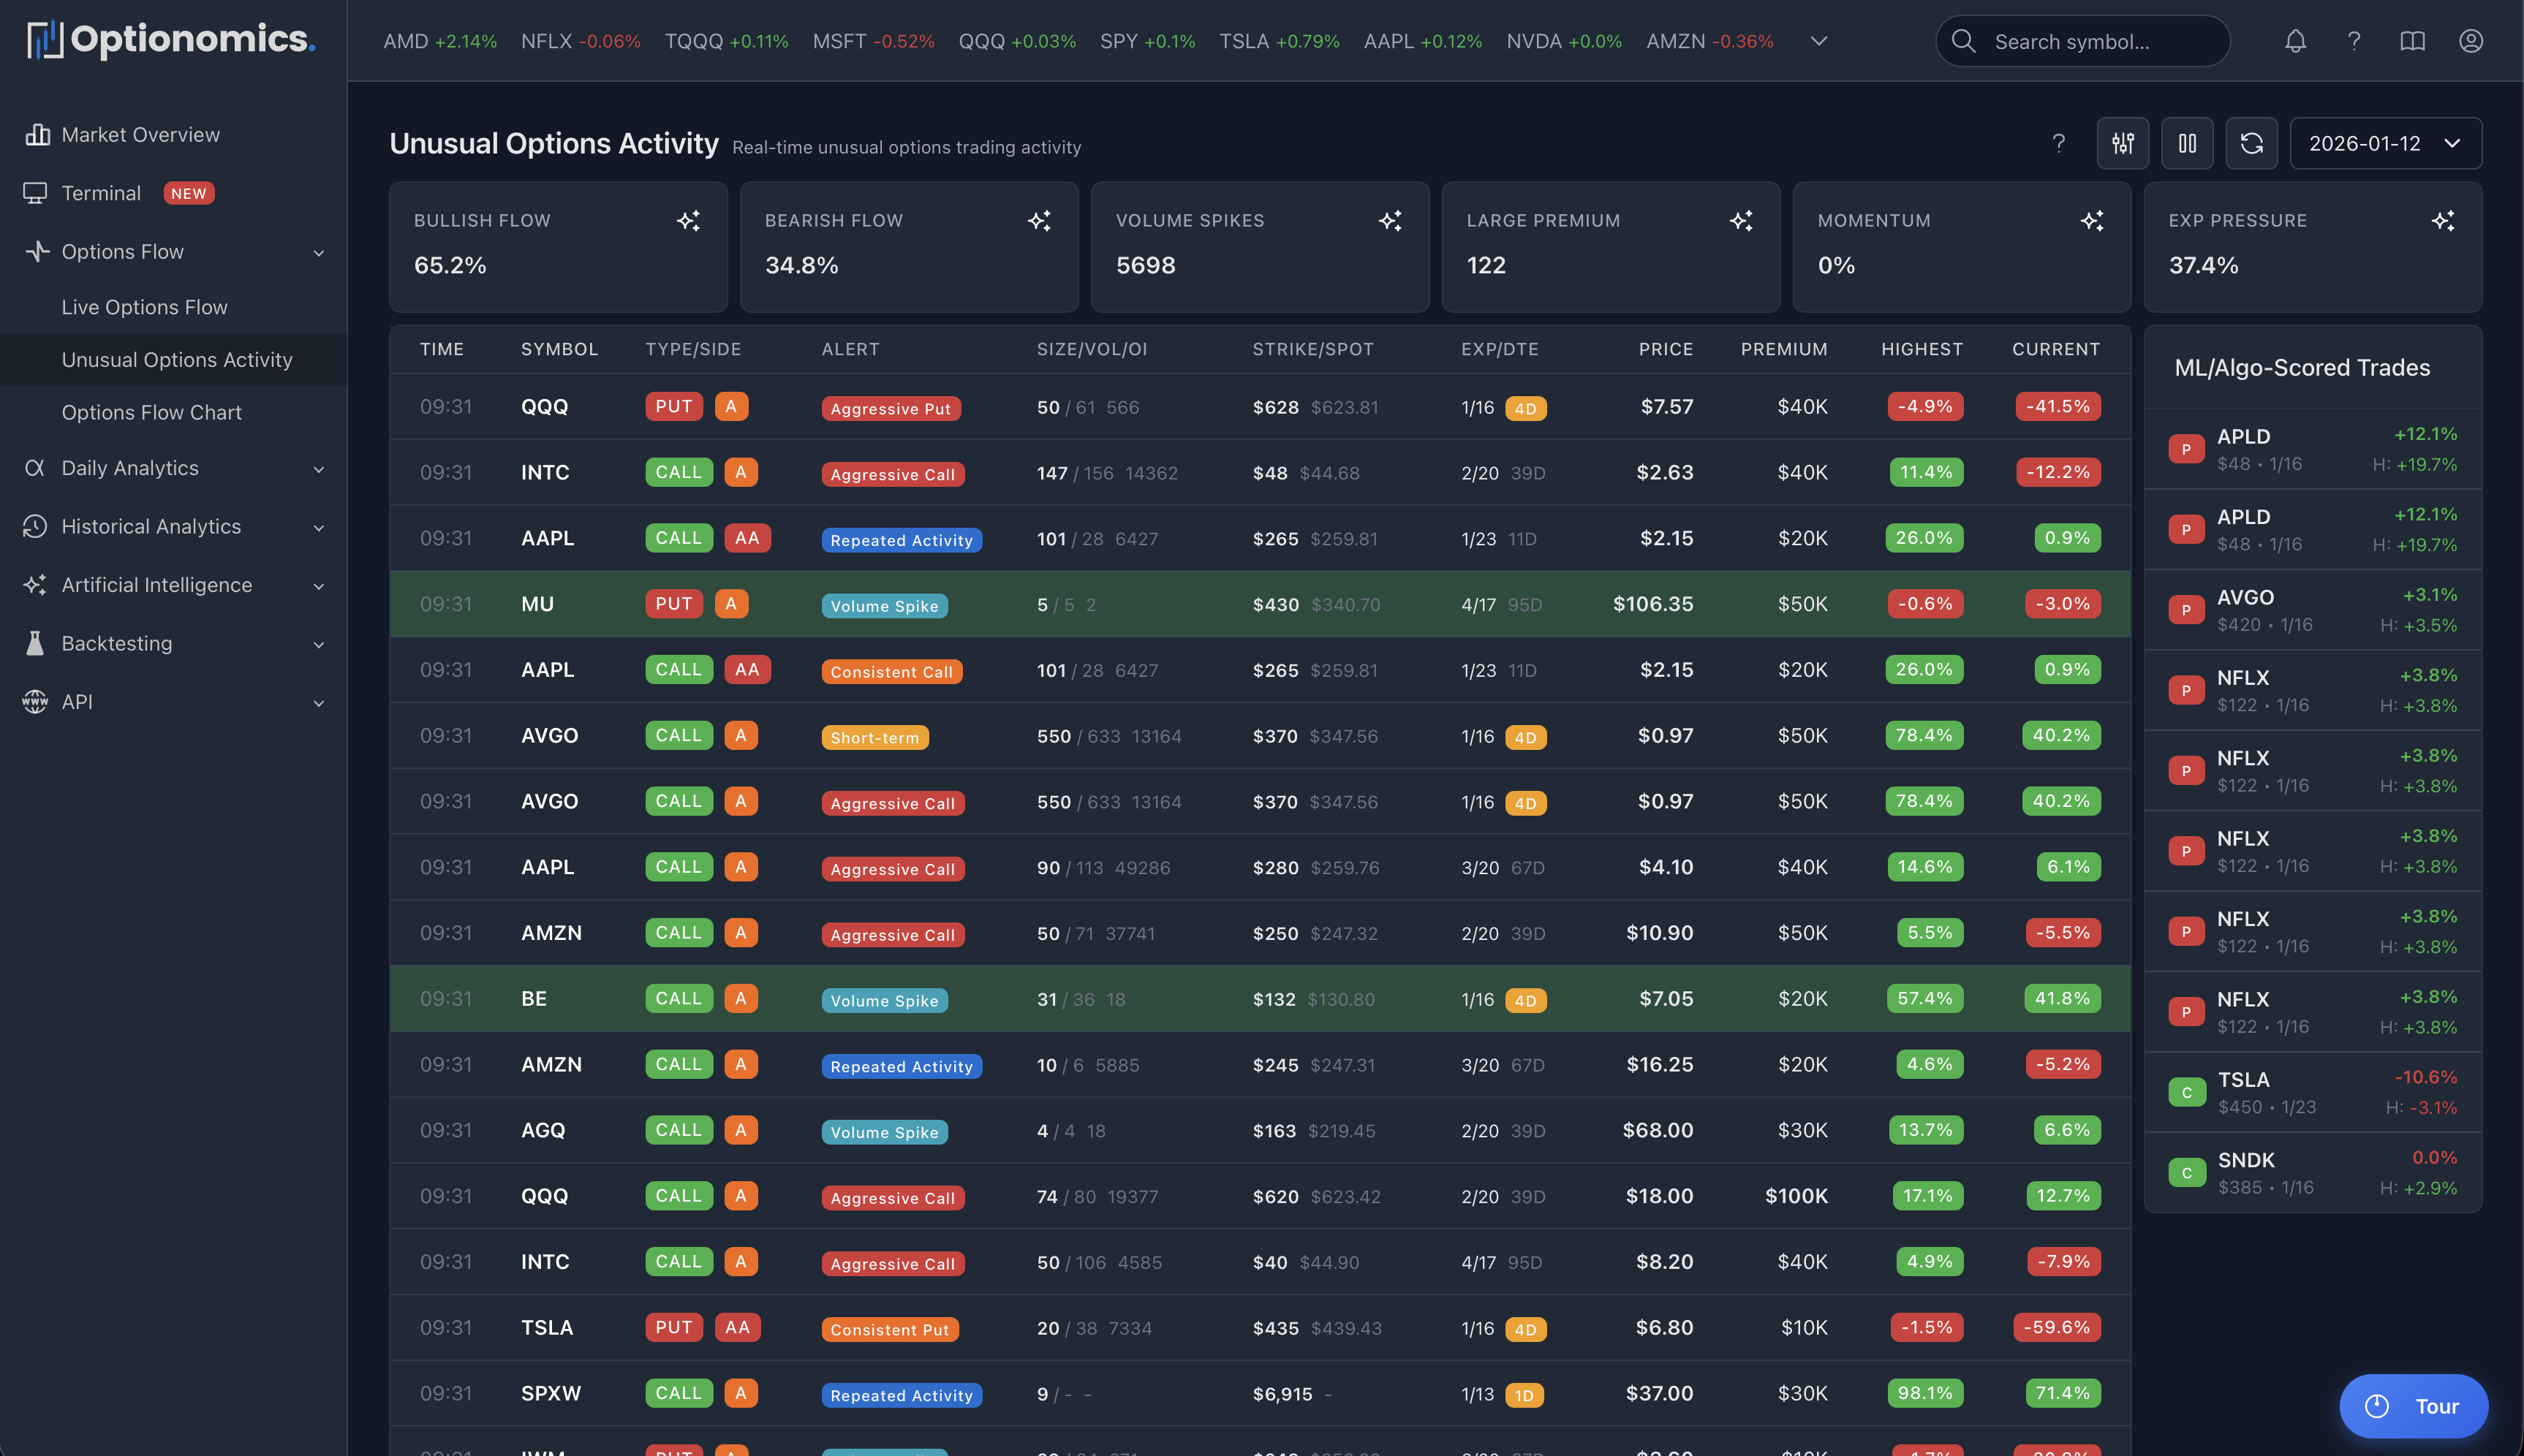
Optionomics scans every options trade and flags activity that stands out from normal patterns—large trades, aggressive execution, unusual volume, and more.
Availability: Gamma plan and higher ($59/month+)
How We Detect Unusual Activity
Every trade is analyzed and scored (0-100) using machine learning and statistical models based on:
| Factor | What We Analyze | Weight |
|---|---|---|
| Size | Contracts relative to typical volume for that option | High |
| Premium | Dollar amount ($25K+ triggers analysis) | High |
| Execution | Aggressive (at/above ask or at/below bid) | Medium |
| Volume/OI Ratio | Trade size vs open interest (>10% is unusual) | High |
| Timing | Concentrated activity in short windows | Medium |
| Historical Patterns | Deviation from normal trading patterns | High |
| Order Type | Sweep, Block, ISO orders boost score | Medium |
| Strike Selection | Unusual moneyness or clustering | Low |
Alert Types
Each unusual trade is classified into one or more types:
| Type | Criteria | Base Score | What It Means |
|---|---|---|---|
| Aggressive Call Buying | Call + At/Above Ask + Size ≥50 + Premium ≥$25K | 85 | Strong bullish urgency |
| Aggressive Put Buying | Put + At/Above Ask + Size ≥50 + Premium ≥$25K | 85 | Strong bearish urgency |
| Aggressive Call Selling | Call + At/Below Bid + Size ≥50 + Premium ≥$25K | 80 | Bearish positioning |
| Aggressive Put Selling | Put + At/Below Bid + Size ≥50 + Premium ≥$25K | 80 | Bullish positioning |
| Whale Trade | Premium ≥$500K OR Size ≥1000 contracts | 95 | Institutional-scale positioning |
| Volume Spike | Size ≥10% of open interest | 70 | New positioning, unusual interest |
| IV Spike | IV increase ≥20% in 1 hour | 75 | Volatility expansion |
| Short-Term Activity | DTE ≤7 + Size ≥100 + Premium ≥$50K | 70 | Near-term event expectation |
| Consistent Call Buying | 3+ call buys in 30 min + Total size ≥200 | 75 | Accumulation pattern |
| Consistent Put Buying | 3+ put buys in 30 min + Total size ≥200 | 75 | Distribution pattern |
| Repeated Activity | 3+ similar trades in 5 minutes | 65 | Algorithmic or urgent trading |
Unusual Score
The unusual score (0-100) indicates how significant and unusual the trade is:
| Score | Priority | Frequency | Typical Characteristics |
|---|---|---|---|
| 90-100 | Critical | ~1-2% of alerts | Whale trades, multiple boosters, extreme urgency |
| 80-89 | Very High | ~5-8% of alerts | Large premium, sweeps, aggressive execution |
| 70-79 | High | ~15-20% of alerts | Significant size, volume spikes, good premium |
| 60-69 | Moderate | ~30-35% of alerts | Above-average trades, some unusual factors |
| 50-59 | Low | ~40% of alerts | Marginally unusual, meets minimum thresholds |
| <50 | Very Low | Not shown | Filtered out as noise |
Dashboard Metrics
| Metric | Description |
|---|---|
| Bullish/Bearish Flow | % of unusual activity by direction |
| Volume Spikes | Count of volume spike alerts |
| Large Premium | Count of big dollar trades |
| Momentum | Intraday momentum % |
| Exp Pressure | % of alerts expiring soon |
Quick Filters
| Filter | Shows |
|---|---|
| High Score | Score ≥80, Premium ≥$500K |
| Whale Trades | Only whale alerts |
| Volume Spikes | Only volume spike alerts |
| Aggressive Buying | Aggressive call buying |
| No ETFs | Exclude ETF/index options |
Important Context
Not all unusual activity is what it seems:
- A big put buy could be a hedge, not a bearish bet
- A large sale might be closing a winner, not opening a short
- You only see one leg—it might be part of a spread
Always check: News, earnings dates, technical levels, market context.
Remember: Unusual activity shows what traders are doing, not what will happen. Large traders can be wrong, hedging, or part of complex strategies. Use as market intelligence, not trading signals.