Market Calendar
Who reports, and what prints
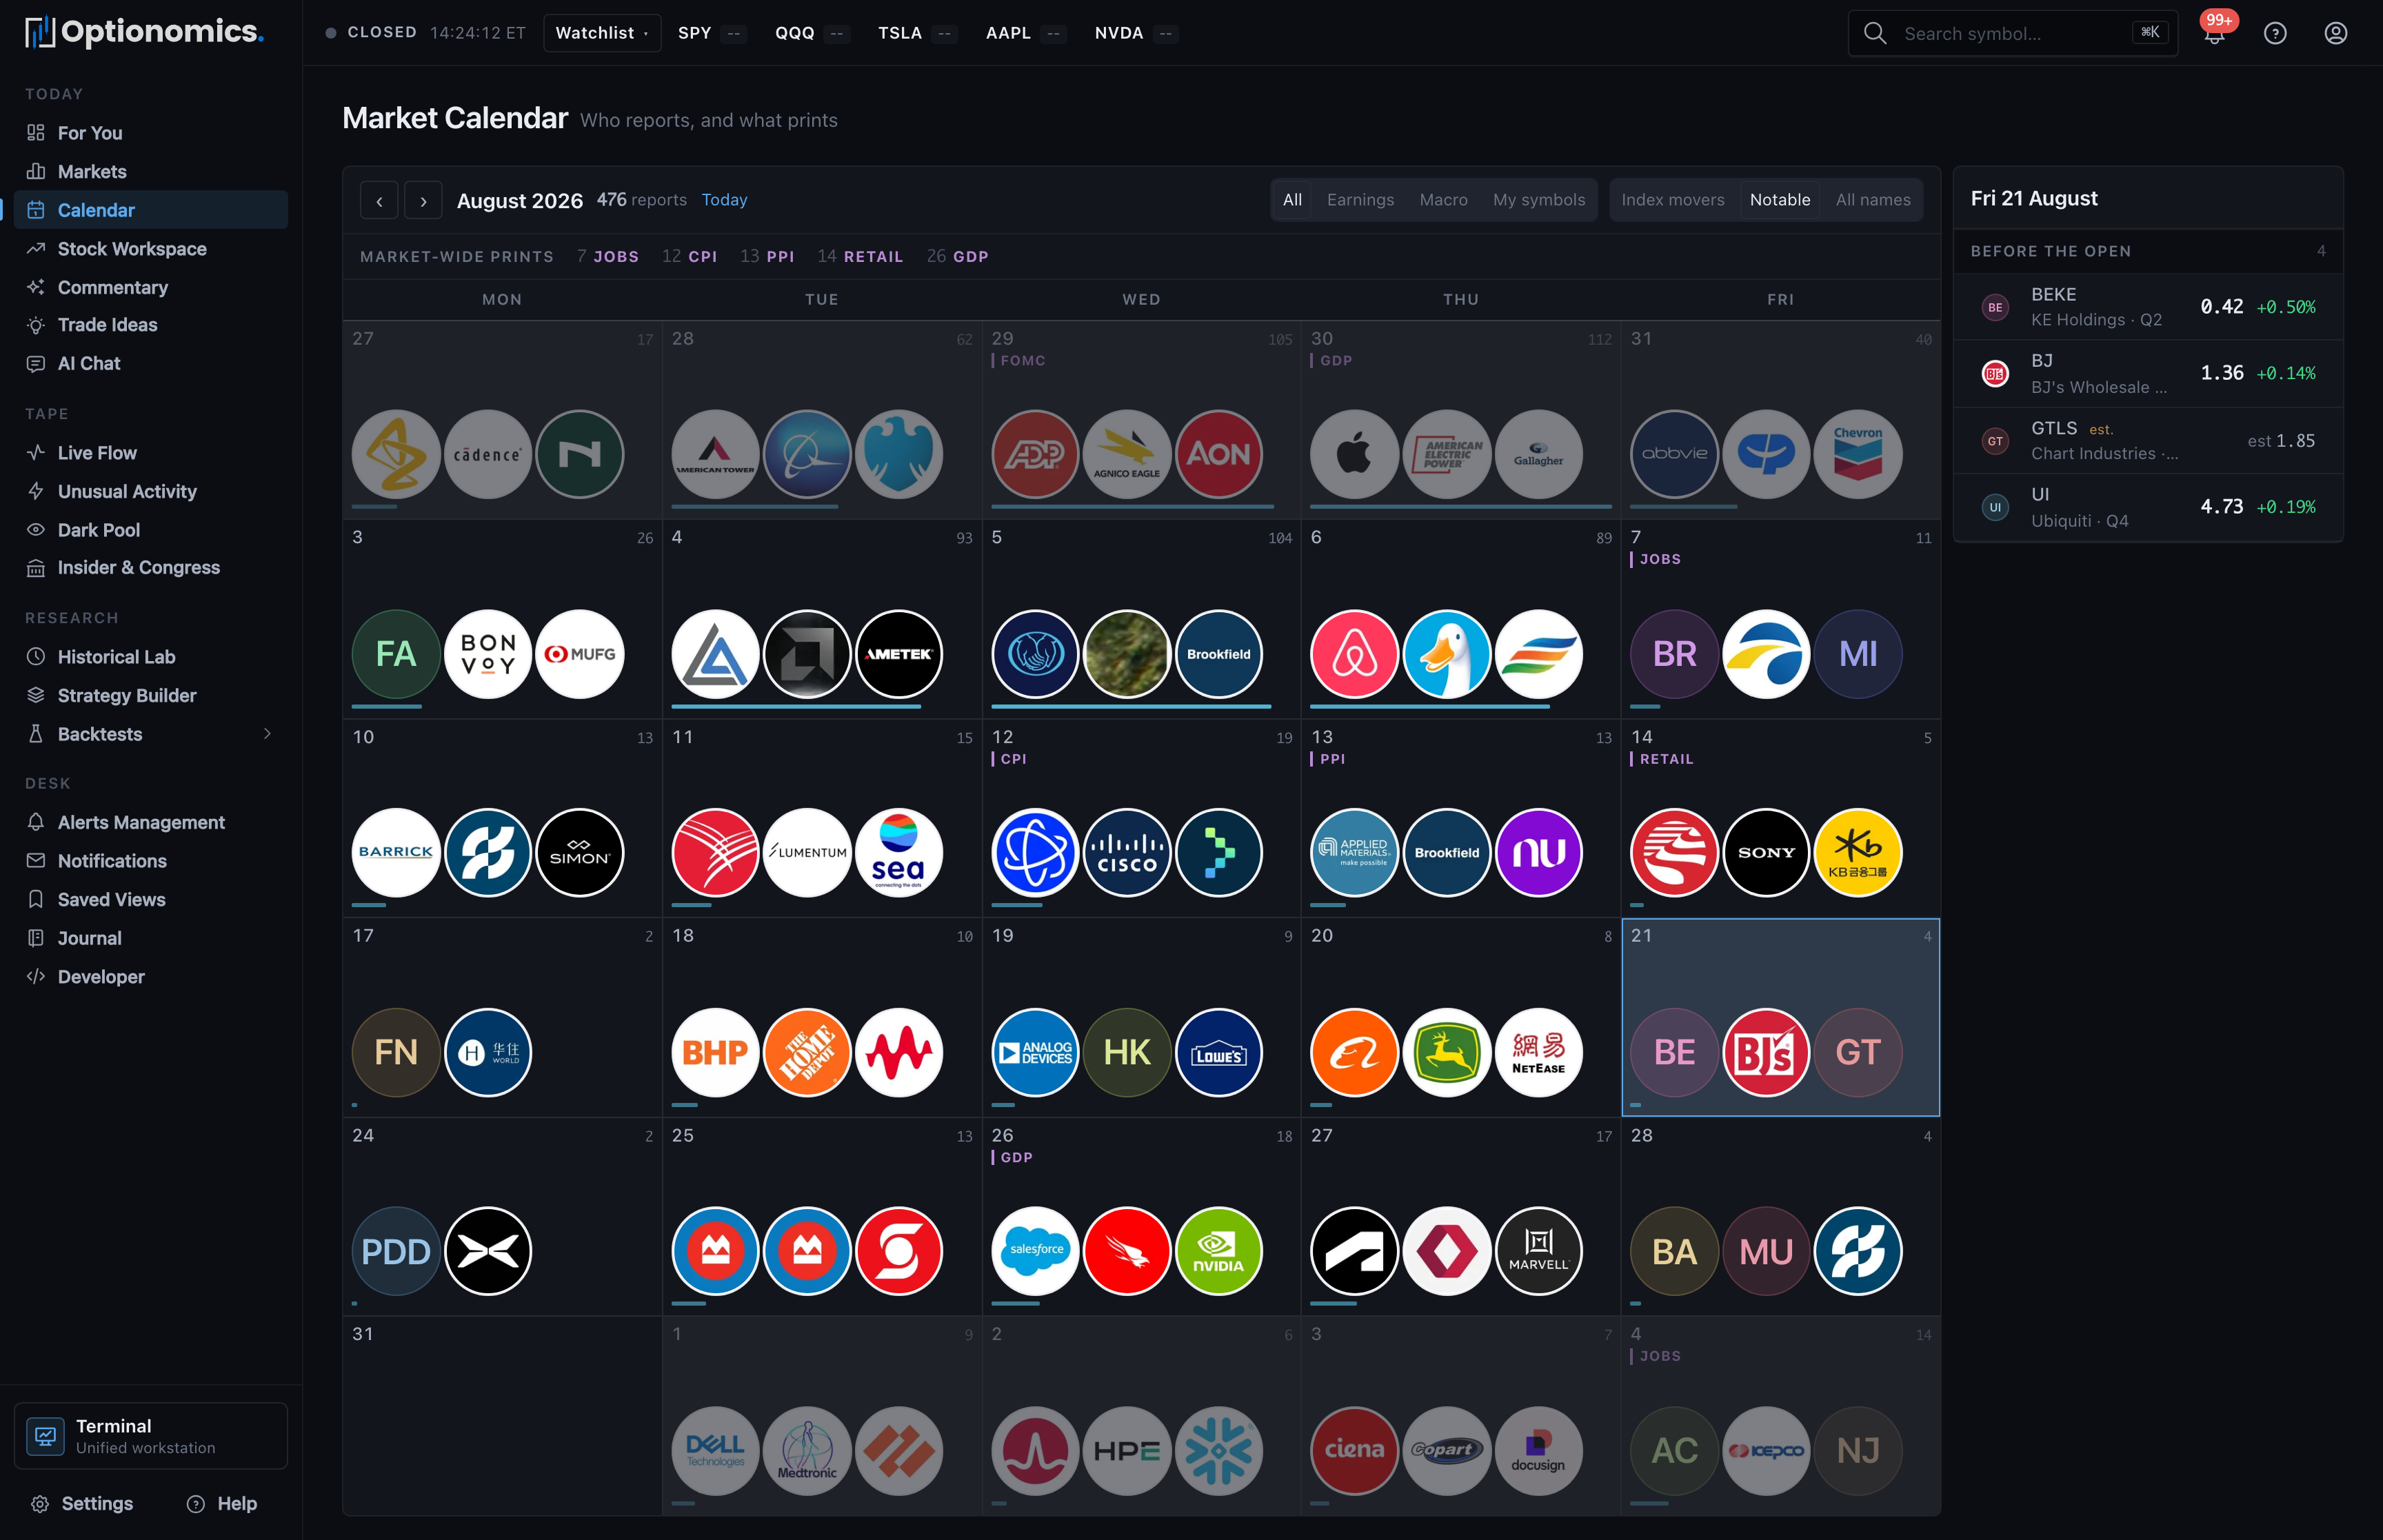
What the Market Calendar is
The Market Calendar puts scheduled market events—company earnings and macro prints such as CPI, jobs reports, retail sales, GDP, and FOMC days—on one timeline, so you can see what could move the tape before it does. Options traders live and die by dates: an “unusual” print often stops being unusual once you notice the earnings date two days out.
Availability: All signed-in users.
Open it: Sidebar → Calendar (also at /calendar). The Market Overview shows the same session’s events condensed as Today’s Catalysts, and each stock’s Earnings tab links here for its Upcoming dates.
The month grid
The left side is a month grid. Each day cell shows:
- The earnings count for that day
- Up to three macro tokens (e.g. CPI, JOBS, FOMC) for market-wide prints
- Company logo marks for the day’s notable reporters
- A load bar scaled against the busiest day in view, so heavy weeks stand out at a glance
A market-wide prints strip above the grid lists the month’s macro events in one line. Keyboard users can move with the arrow keys (days and weeks), PageUp/PageDown (months), and t (today).
Lenses and importance
Four lenses narrow the timeline:
| Lens | What it shows |
|---|---|
| All | Everything—earnings and macro together |
| Earnings | Company reports only |
| Macro | Market-wide prints only |
| My symbols | Only names on your watchlists |
Outside the “My symbols” lens, a breadth filter keeps the grid readable: Index movers (the highest-importance names), Notable (the default), or All names.
The day panel
Selecting a day opens its detail panel. Earnings are grouped by bell—Before the open, During the session, After the close, and Time not given—with times rendered in your display timezone. Each row shows:
- The ticker and company name (an est. tag marks dates the provider has projected rather than confirmed)
- The EPS estimate before the report, or the actual and surprise once it has printed
- Quick links: Filings (the symbol’s earnings analyses), Build (the Strategy Builder loaded with the name), and Tape (the day’s flow) for tradeable sessions
While you are viewing today, the panel refreshes itself every minute, so intraday actuals and macro readings appear without a reload.
A practical routine
- Sunday or Monday: open the month grid on the My symbols lens and note which of your names report this week.
- Each morning: check today’s bell groups—what prints before the open, and what lands after the close.
- Before entering any trade: confirm the name’s next report date. Term structure and skew will usually confirm what the calendar tells you.
- After a report: use the Filings link to read the AI earnings analysis once it lands.
Remember: Scheduled events explain much of what looks unusual in options pricing. Check the calendar before you attribute meaning to elevated IV, a kinked term structure, or heavy short-dated flow.
